
Pencegahan karhutla di Provinsi Riau, Indonesia dilakukan dengan berbagai cara – mulai dari Program Desa Bebas Api (Fire Free Village Programme) yang berbasis kemasyarakatan dan kolaborasi serta ketanggapan tim pemadam kebakaran di lapangan hingga kontribusi vital pantauan dari angkasa.Data titik panas yang direkam beragam satelit mengidentifikasi titik-titik panas atau hotspots dengan potensi kebakaran.

Istilah hotspot atau titik panas tersebut telah menjadi bagian dari upaya untuk mencegah kebakaran di Sumatera dan menjadi istilah umum.

Meskipun titik panas yang  dieteksi satelit tidak selamanya merupakan fire spot atau titik api, komitmen untuk mencapai masa depan yang bebas karhutla berarti setiap indikasi titik panas harus diinvestigasi.

Kami berbincang dengan Manajer Pencegahan Kebakaran, Craig Tribolet mengenai titik-titik panas/ hotspot serta pengintegrasian pemantauan titik panas dalam upaya pencegahan karhutla di Riau.

Apakah definisi titik api atau yang lebih dikenal umum sebagai hotspot?

Kami menggunakan data satelit dari dua platform terpisah yang berbasis NASA untuk membantu memantau risiko potensi kebakaran di dalam area konsensi APRIL; hal ini berjalan bersamaan dengan elemen-elemen program pencegahan kebakaran kami.

Salah satu instrumennya, MODIS, berada di satelit AQUA dan TERRA milik NASA. Instrumen tersebut mengidentifikasi area dengan temperature 37oC pada malam hari atau 42oC pada siang hari. Tim lapangan kami kemudian akan mencari tanda-tanda api dalam radius 1,1 km. Platform terbaru lainnya, VIIRS, berada pada satelit NASA/NOAA dan menggunakan teknologi inframerah. Ketika satelit-satelit tersebut mengidentifikasi sebuah titik panas dalam sebuah rentang spektral, tim lapangan kami akan melakukan verifikasi lapangan dalam radius 375 meter. Penting untuk dicatat bahwa satelit-satelit ini tidak secara harfiah menangkap sebuah titik, tapi mengidentifikasi sebuah daerah yang harus dicek secara fisik untuk mengetahui di mana lokasi titik panas yang sebenarnya.

Apa saja jenis teknologi yang digunakan dalam mengidentifikasi titik-titik panas/ hotspot dan siapa yang mengoperasikan satelit tersebut?

Pencitraan berbasis satelit berasal dari dua platform NASA dan dianalisis dengan menggunakan algoritma titik panas tertentu melalui sebuah layanan NASA yang disebut Fire Information for Resource Management System (FIRMS) yang mengirimkan data saat itu juga (real-time data) dalam kisaran waktu tiga jam sejak satelit melintasi area-area konsensi kami.

Data titik panas dapat dengan mudah dilihat oleh masyarakat umum dengan mengakses beberapa platform seperti situs Global Forest Watch atau ASEAN Haze Online Map.

Siapa yang memantau dan memberitahukan Anda jika terdapat titik panas?

Setiap pagi kami menerima sebuah unduhan satelit, termasuk data seluruh titik panas terbaru dengan lokasi garis lintang/bujurnya yang berada di dalam atau berdekatan dengan area konsesi kami.

Tim Perencanaan kami menganalisis data dan memetakan informasi lokasi garis lintang dan bujur dari titik-titik panas tersebut. Titik-titik panas yang berada di dalam atau dekat dengan area konsensi kami akan dikirim ke Tim Perlindungan dan Kebakaran masing-masing Estate, yang kemudian ditugaskan untuk melakukan verifikasi lapangan di setiap area titik panas tersebut.

Berapa banyak rata-rata peringatan titik panas/ hotspot yang Anda terima?

Selama musim kemarau, kami bisa mendapat puluhan titik panas dalam satu hari. Namun bisa juga tidak ada sama sekali.

Ketika terjadi titik panas dalam jumlah banyak, kondisi ini menjadi menantang karena titik panas yang diidentifikasi oleh MODIS dapat terletak di mana saja dalam radius satu kilometer; berkat VIIRS menjadi lebih mudah karena hanya menjadi 375 meter. Ketika menemukan dalam jumlah besar, kami menggunakan helicopter untuk mengecek titik panas tersebut; kerap kali yang ditemukan adalah atap seng dari berbagai bangunan.
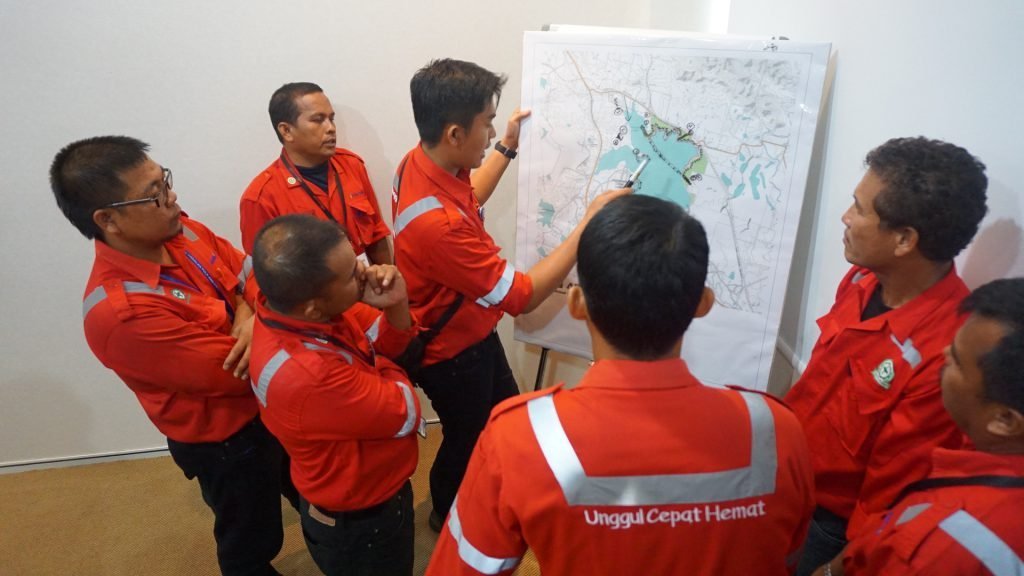
FireTeamDiscussion 1 — APRIL Asia

Diskusi Tim APRIL di Control Room

Apa runtutan tindakan yang dilakukan ketika muncul sebuah peringatan titik panas?

Tim Perlindungan dan Kebakaran Estate menggunakan sebuah GPS untuk melacak lokasi titik panas berdasarkan informasi dari Tim Perencanaan. Hal ini juga digunakan sebagai rekam bukti bahwa kami menindaklanjuti informasi titik panas dan melakukan verifikasi lapangan.

Terkadang, kami butuh untuk berkendara beberapa jam dari estate ke suatu area untuk melakukan verifikasi lapangan. Pada area-area dengan medan sulit atau sangat terpencil, kami juga akan menggunakan drone untuk mendapatkan sebuah gambar atas bentang alam tersebut. Drone menjadi penting karena kita dapat memperoleh data hanya dalam waktu lima menit sejak mereka mengudara tanpa harus mengunjungi sebuah area tertentu dan sebuah drone dapat memberi kami sebuah gambaran yang terpercaya.

Tim Kebakaran juga menganalisa risiko mengingat bahwa 100% kebakaran disebabkan oleh manusia; tim tidak akan berkendara tanpa arah dengan harapan mereka akan menemukan titik panas. Jadi, mereka memprioritaskan area-area berisiko tinggi – di antaranya area-area pembukaan lahan terbaru atau area perambahan liar, pengembangan perkebunan baru, jalur-jalur akses seperti jalan raya dan sungai, perumahan.

Pada hari yang cerah, pencarian sebuah titik panas tidak sulit bagi tim untuk melihat atau mencium bau asap.

Ketika Tim mulai mendapatkan lusinan peringatan titik panas, di saat itulah kami akan menggunakan helikopter untuk memastikan dari udara. Tentunya terdapat rangkaian tindakan yang berbeda jika sebuah titik panas (hotspot) terkonfirmasi sebagai titik api (fire spot).

Seberapa penting pemantauan titik panas/hotspot dalam pencegahan kebakaran secara keseluruhan?

Pemantauan merupakan hal yang penting untuk memastikan respon cepat – semakin cepat pendeteksian titik api, semakin kecil kebakaran yang terjadi dan semakin mudah dan aman untuk padamkan. Jadi alat-alat penginderaan jarak jauh secara waktu nyata (real-time) seperti informasi titik panas (hotspot) menjadi sangat berguna – khususnya pada area-area terpencil yang sulit dijangkau oleh tim patroli lapangan. Informasi hotspot menjadi bagian dari toolkit pemantauan yang lebih luas termasuk patroli darat dan udara berkala serta informasi yang dikirim oleh masyarakat ke Sambungan Langsung (Hotline) Kebakaran 24 jam kami.

Berapa persentase dari titik panas/ hotspot yang terbukti merupakan titik api dilapangan?

Faktanya sekitar 5% dari titik panas merupakan titik api – sebagian besar dari hotspot/titik panas tersebut cenderung merupakan lokasi-lokasi pada bentang alam yang memanas seperti tanah kosong, perairan dangkal serta struktur bangunan yang didirikan manusia seperti atap seng. Dan juga, awan dan asap dapat secara serius membatasi kemampuan satelit untuk mendeteksi kebakaran.

Meski demikian, pemantauan titik panas merupakan bagian yang sangat penting dari upaya pendeteksian karhutla secara keseluruhan karena tujuan utama kami adalah “Zero Fire”. Tidak ada satu elemen pun dari toolkit pencegahan kebakaran kami yang kami perlakukan secara eksklusif. Verifikasi karhutla di lapangan, kegiatan inisiatif masyarakat, penggunaan  drone dan helikopter, serta hasil pantauan berbagai satelit dipadukan dalam upaya pencegahan dan penanggulangn karhutla.

svg+xml;charset=utf — APRIL Asia
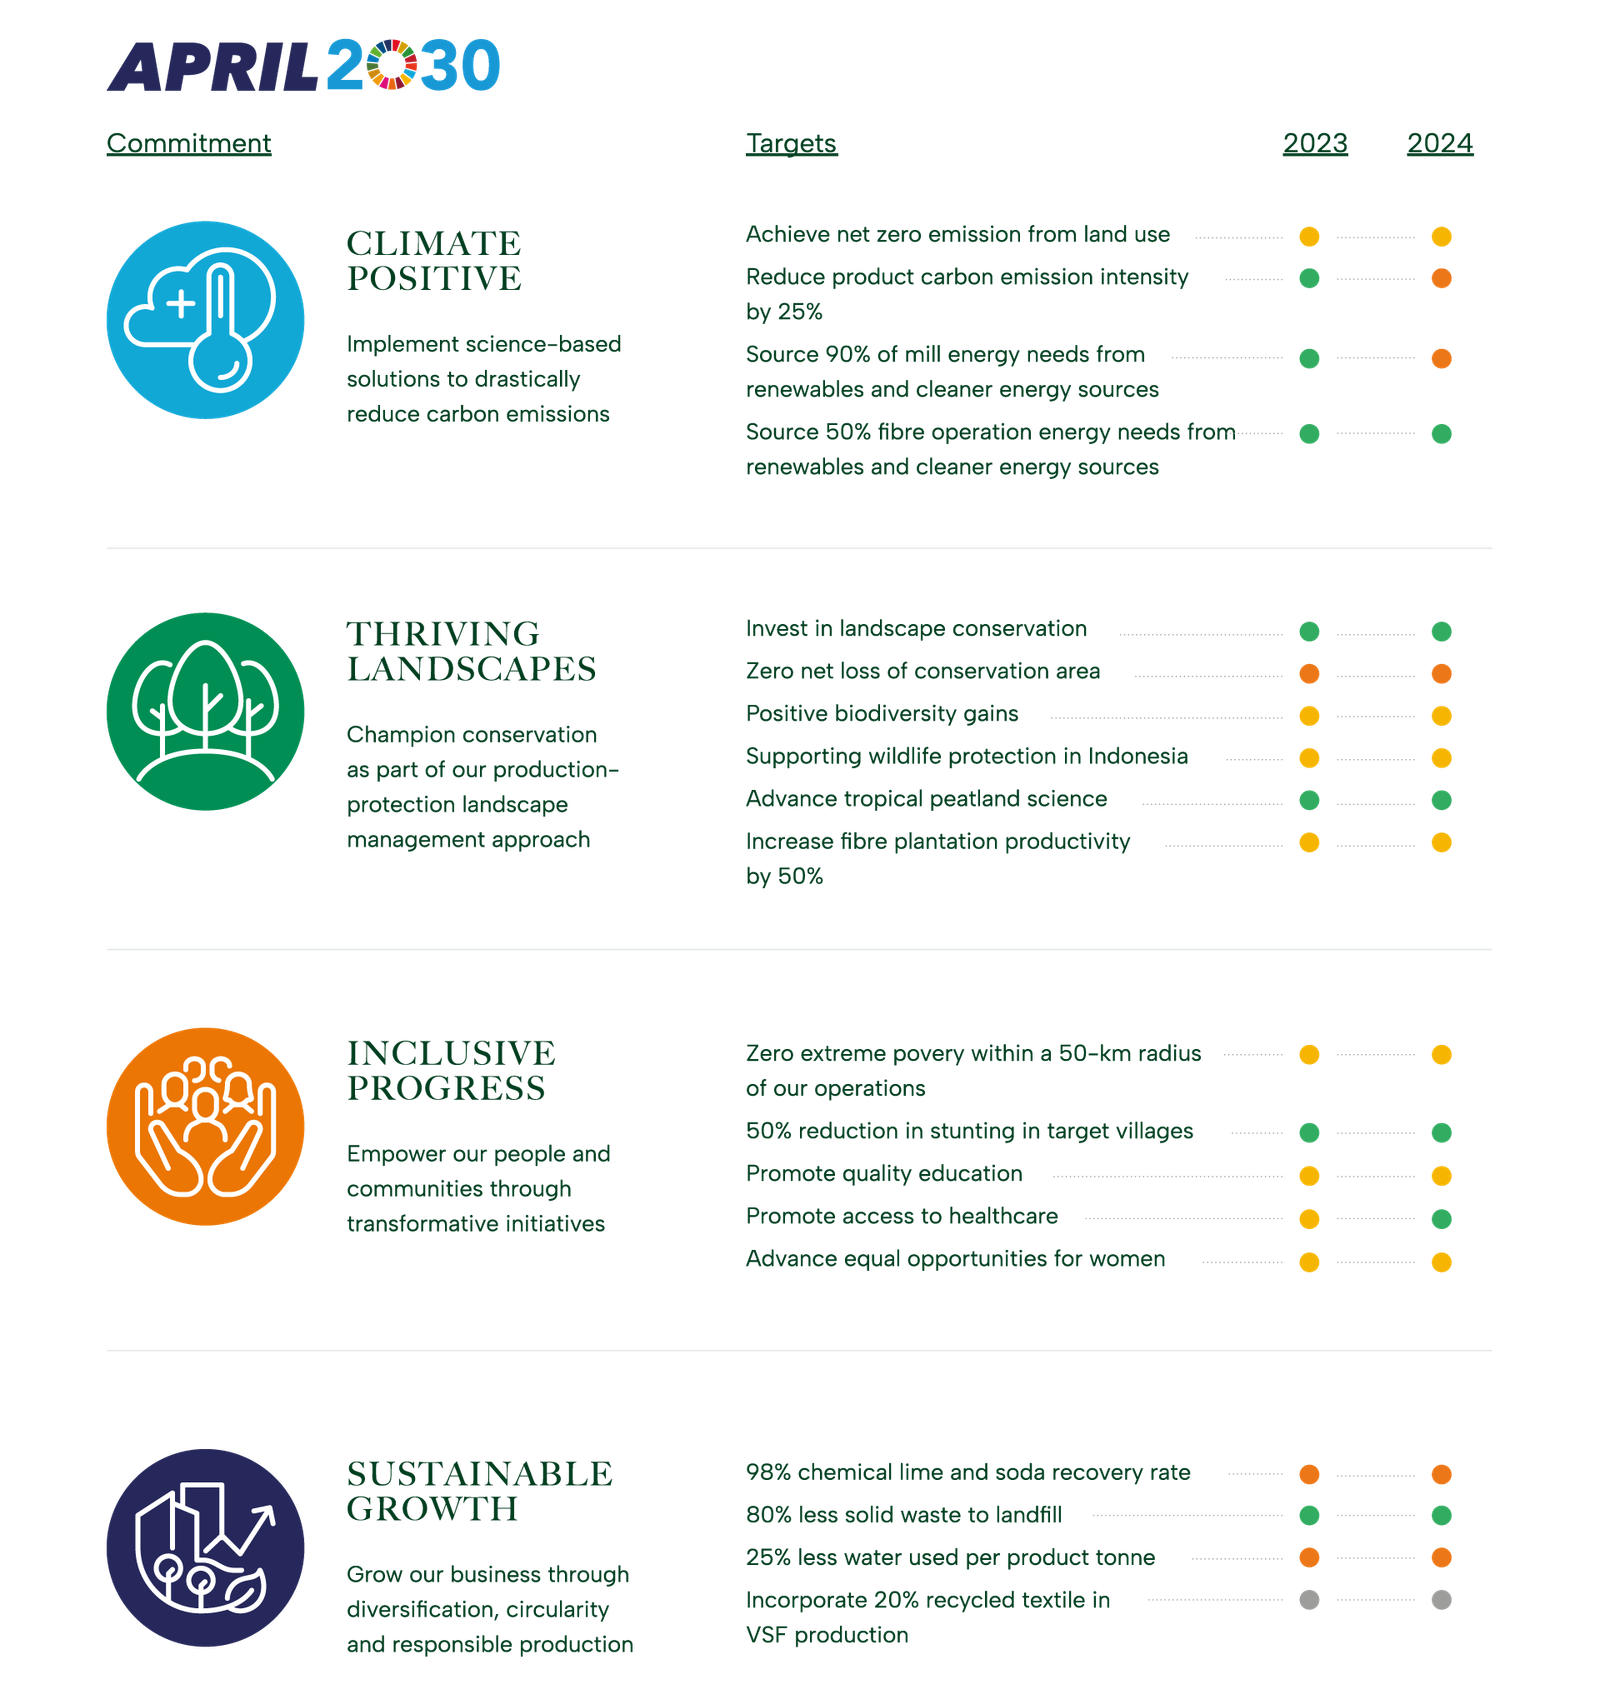
sustainable growth — APRIL Asia

Method

Waste disposed is recorded through various means of measurement including estimation of weight by waste type. Particular waste types as described above are measured as a wet waste and converted to a bone dry (BD) weight. The wet waste weight is multiplied by the consistency of each waste type to determine the BD. The consistency is predetermined by the lab.

Baseline
71kg/T

Performance 2022

On Track

sustainable growth — APRIL Asia

Method

The DPTW utilisation rate and % of textile waste per tonne of product will be based on R&D lab/pilot/demo procedures.

Baseline
0%

Performance 2022

In Development

sustainable growth — APRIL Asia

Method

Water consumption per tonne of product is calculated based on water consumed in the production of saleable pulp, paper, viscose staple fiber and viscose yarn measured by flow meters, via calculation and water balances divided by the production figures for saleable pulp, paper, viscose staple fibre and viscose yarn.

Baseline
28 m3/T

Performance 2022

Not Progressing

sustainable growth — APRIL Asia

Method

Soda content within the liquor cycle and losses are determined by means of mass balance based on daily lab analysis.

Lime volume in the lime kiln and losses are determined by means of lime make-up.

The recovery rate is calculated net of the percentage of make-up amounts added. The annual figure is based on the average monthly recovery rate.

Baseline
96%

Performance 2022

Not Progressing

inclusive progress — APRIL Asia

Method

Number of Mill and Nursery contractor calculated based on Man Power data which grouped by gender level calculated as a monthly average.

Baseline
2571

inclusive progress — APRIL Asia

Method

The number of own and supply partners employees is calculated based on year-end Man Power data which is grouped by gender. The identification of leadership position refer to employees’ grade D2 or Manager level and above.

Baseline
55 women employees in leadership positions

Performance 2022

Progressing

inclusive progress — APRIL Asia

Method

Women’s effective participation is identified from the participation list for each program. Percentage of female participation is calculated by the number of women participating divided by the total participants.

Baseline
34%

Performance 2022

Progressing

inclusive progress — APRIL Asia

Method

In development

Baseline
In development

Performance 2022

Progressing

inclusive progress — APRIL Asia

Method

In development

Baseline
In development

Performance 2022

Progressing

inclusive progress — APRIL Asia

Method

In development

Baseline
In development

Performance 2022

Progressing

inclusive progress — APRIL Asia

Method

We engaged third party to conduct assessment in APRIL-supported schools using the framework that was developed by Research Triangle Institute (RTI) and USAID.

Baseline
In development

Performance 2022

Progressing

inclusive progress — APRIL Asia

Method

Poverty mapping is identified through:

  1. Desktop analysis using National Statistics, Village Potential Statistics, SMERU Poverty Map.
  2. On-the-ground verification through FGD, village transect walk, interview with community.

Baseline
3%

Performance 2022

Progressing

thriving landscapes — APRIL Asia

Method

Peer-reviewed scientific journal publication standards

Baseline
1

Performance 2022

On Track

thriving landscapes — APRIL Asia

Method

Documentation of Participation (presentation of papers or posters) in national and international dialogues, workshops and conferences

Baseline
6

Performance 2022

On Track

thriving landscapes — APRIL Asia

Method

Number of scientists from universities and research institutions that have collaborated with APRIL on peatland management during the calendar year

Baseline
9

Performance 2022

On Track

thriving landscapes — APRIL Asia

Method

Wood deliveries (excluding open market supply) to the mill are used as a basis to calculate MAI (Tonnes/ Ha/Yr). The MAI is based on the 3 year area weighted rolling average growth for all closed compartments.

Baseline
20T/ha/yr

Performance 2022

On Track

thriving landscapes — APRIL Asia

Method

Methodology to be developed specific to animal species and does not include plants. Qualifying initiatives may vary widely in nature but must have the animal protection as the primary objective.

Partnerships will be developed and documented in line with an overarching strategy prioritizing stakeholders and threats specific to the country of Indonesia assessed.

Performance 2022

Progressing

thriving landscapes — APRIL Asia

Method

May include various initiatives relating to conservation of RTE species to be defined in a priority list, initiatives may be conducted solely or in collaboration with other stakeholders.

Baseline
2

thriving landscapes — APRIL Asia

Method

Methodology to be developed to measure change in ecosystem services and values over time (carbon sequestration, water provision, resource provision including fish and honey)

Baseline
not yet developed

thriving landscapes — APRIL Asia

Method

Reports for reforestation of previously encroached and degraded area including all areas where assisted natural regeneration, planting or enrichment planting of species that improve habitat value have taken place during the year but excludes natural regeneration.

Baseline
275 ha

Performance 2022

Progressing

thriving landscapes — APRIL Asia

Method

Area within conservation is derived from land bank which is based on land cover analysis and is updated annually to capture any boundary changes, land use changes or measurement data.

Baseline
0 ha Net loss

Performance 2022

Not Progressing

thriving landscapes — APRIL Asia

Method

Landscape conservation funding includes restoration and conservation costs associated with the RER as well as the allocation of a proportion of the costs related to APRIL’s maintenance of conservation values under its production-protection model. The allocation is based on proportionate amount of each cost that is related to conservation and restoration.

The wood volume is based on wood delivered to the Mill.

Baseline
USD$0.7 per tonne of plantation fiber

Performance 2022

On Track

climate positive 1 — APRIL Asia

Method

Mill

Calculate from the records of fuel types used the amount consumed in boilers to generate power, heat and steam including energy use for mobile & including transportation. Each of the fuel types are converted to energy expressed by Giga Joule Lower Heating Value (GJ LHV) following the IPCC guidelines.

Baseline: 87%

Performance 2022

On Track

Forest Operations

Calculate from the records of fuel types the quantity consumed by major categories of forest management activities by Fiber operations.

This covers energy used for Forest operations, infrastructure including wood transport from estate to mill; When a blend of fuel types is used (such as B20) the contribution to renewable and cleaner energy targets is calculated separately for each fuel rather than considering the blend as a cleaner fuel type.

Baseline: 19%

Performance 2022

Progressing

climate positive 1 — APRIL Asia

Method

APRIL follows the international GHG protocol as developed by WRI/WBCSD to develop its emissions profile. The total emissions measured as emissions intensity is calculated based on tonnes of Scope 1 and 2 Mill Greenhouse Gas Emissions per tonne of product (paper, pulp and viscose). The emissions boundary scope covers gate-to-gate (wood processing in wood yard until pulp, paper and viscose production) of the three main GHGs: CO2, CH4, and N2O.

Baseline
0.55 tCO2e/product tonne

Performance 2022

On Track

climate positive 1 — APRIL Asia

Method

To quantify the total GHG emission and removals across APRIL’s land bank from land use, APRIL follows the GHG Protocol Agricultural Guidance and IPCC Guidelines for Agricultural, Forestry, and Other Land Use. To detect the land cover change within the look-back period, i.e. 20 years APRIL utilized the remotely sensed data.

The GHG emission will be calculated as the total of carbon stock changes in woody biomass and soil organic carbon and include all major carbon fluxes such as peat decomposition, plantation growth and harvesting, and fires.

To quantify the amount of carbon unit to balance the emission, the Verified Carbon Standard (VCS), the Climate, Community and Biodiversity Standards (CCB), or other internationally accepted standard will be used.

Performance 2022

Progressing

This site is registered on wpml.org as a development site. Switch to a production site key to remove this banner.