International conservation charity Fauna & Flora has been working with APRIL as a key partner in RER since 2013

By Paul Hotham, Senior Conservation Director, Fauna & Flora International

Climate targets and net zero initiatives are deeply embedded into a number of corporate strategies. While many companies have focused their efforts on their climate impacts, corporate biodiversity strategies have typically lacked attention.

US$44tn of economic value generation – is moderately or highly dependent on nature.  While every business is reliant on our natural world, every business will also have a negative impact on nature through their operations and value chains. This creates a vicious circle where business’ impact on nature also creates real and immediate risks to their bottom line.

Paul Hotham

Paul Hotham

For many organisations, realising that their nature impact is not an issue that can be ignored is the first step. The next is to embrace that it’s not too late to change. By acknowledging and taking ownership for past shortfalls, most companies can have a net positive impact on nature in the long run.

The nature conservation charity I work for, Fauna & Flora, works with a number of carefully selected corporate partners leading in nature implementation across their value chains. We partner with companies across a range of industries, to help them achieve better outcomes for nature and the local communities living closest to it.

Often, we work as a trusted advisor to our corporate partners, visiting operating sites and working closely with site and procurement teams in almost all of our work, to embed nature-related decisions across their value chains. In some unique projects, we also have teams working directly on the ground to help manage their conservation projects.

An example of this can be found in Indonesia, where we are working to implement APRIL Group’s ecosystem restoration programme, Restorasi Ekosistem Riau (RER), managing key elements of the project related to biodiversity, climate and communities.

Established in May 2013, the RER programme started with an initial 20,265 hectares on the Kampar Peninsula and has today expanded to over 150,693 hectares. The project comprises a range of different conservation strategies but mainly centres around protecting the landscape from further degradation, and restoring the hydrology, native plant and wildlife species.

As a partner to RER, a large part of our work involves designing and carrying out bespoke surveys of the animal and plant groups that are present in the forest. We then consult with the RER team on the right strategy to conserve that biodiversity while advising on wider issues in conservation.

Thanks to these collaborative efforts, over the last decade the restoration area has seen a rise in the number of species identified, which has been documented annually in the progress reports. The area is now home to a spectacular array of plants and animals including the sun bear, flat-headed cat, Southern pig-tailed macaque and Sumatran tiger.

svg+xml;charset=utf — APRIL Asia

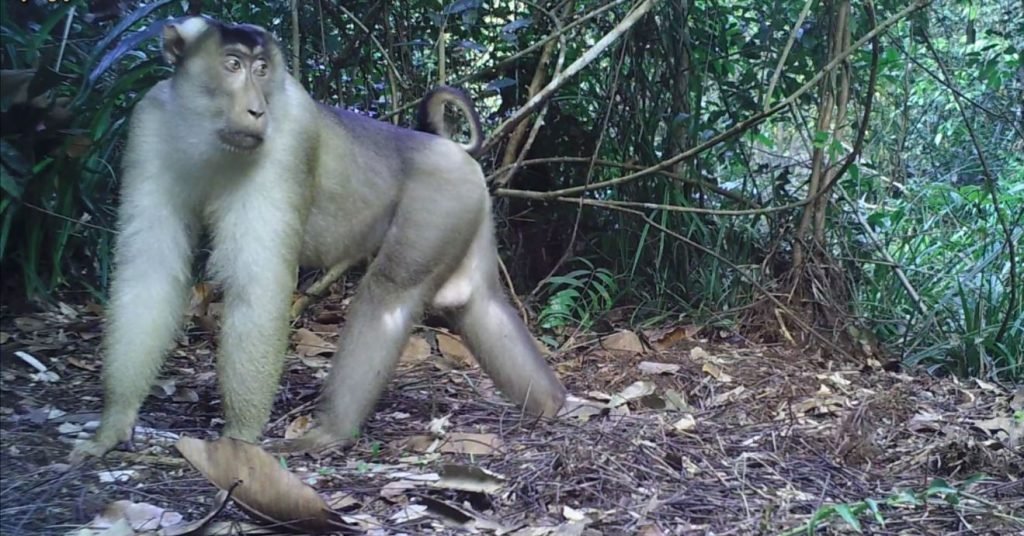
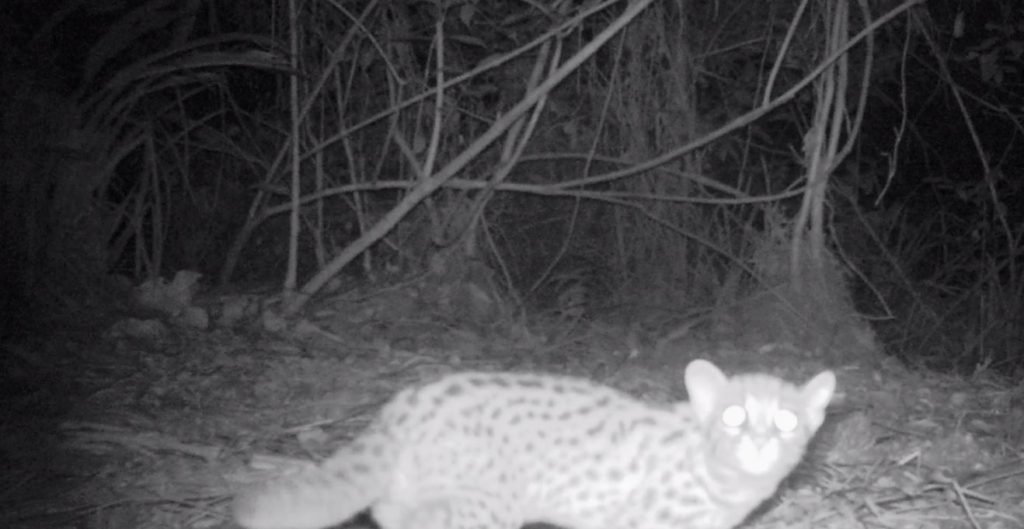
The pig-tailed macaque and leopard cat are two of the species to be found in the RER forests.

Of the 896 species in key taxonomic groups that have been recorded there, 75 are included in the IUCN Red List, with 13 classed as Critically Endangered. It is also located on Sumatra’s largest peatland swamp, with a vast carbon storage capacity.

Unlike many conservation projects, which rely on public or philanthropic funding, RER has a sustainable funding pipeline via APRIL. This means conservation teams have the confidence and investment required for much-needed long-term planning, which can lead to greater conservation outcomes.

And, just as RER relies on APRIL’s funding, the future of APRIL’s business relies on RER. Amongst other benefits, the fiber plantations are dependent on forest land as a source of water. Nature benefits business, just as business can benefit nature.

Globally, the wider context for private sector environmental commitments is currently challenging. As such, we need companies like APRIL to stick to the positive commitments they have already made and, where possible, expand on their sustainability goals to deliver the real change we need to tackle the biodiversity loss and climate crises.

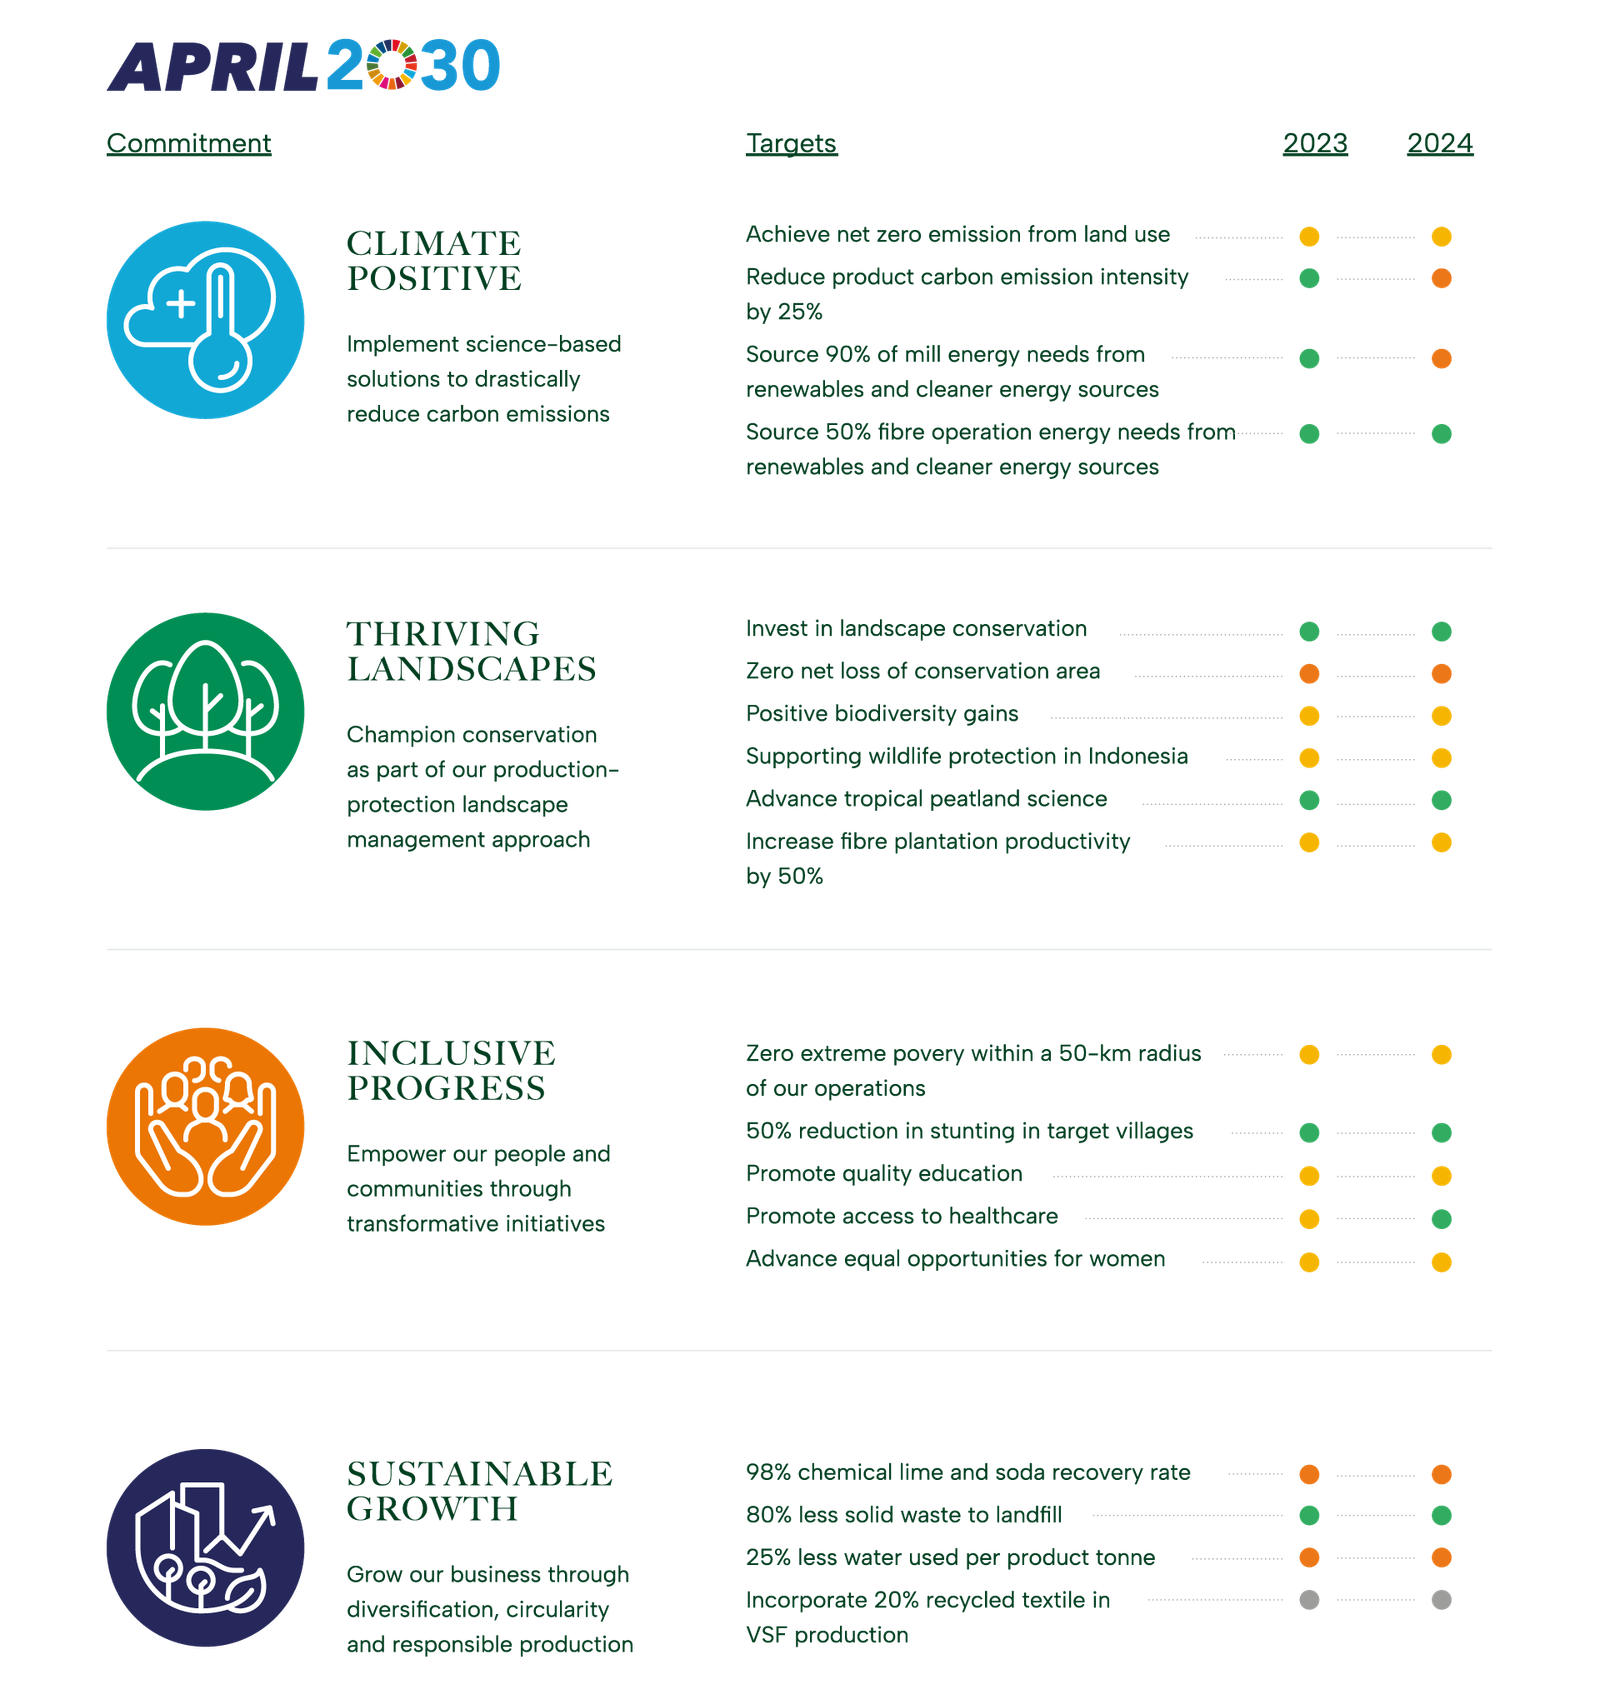
This guest post is published in conjunction with the release of Progress & Pathways: An Update on APRIL’s 2030 Sustainability Commitments and Targets.

APRIL’s conservation work is a key part of its broader 10-year sustainability agenda APRIL2030. Launched in 2020, it includes 18 challenging targets covering everything from carbon emissions to poverty alleviation. The new report published this month marking the mid-way point in the decade takes stock of the successes and challenges so far.

Paul Hotham is Senior Conservation Director at Fauna & Flora International and is a member of the RER Advisory Board.

svg+xml;charset=utf — APRIL Asia
sustainable growth — APRIL Asia

Method

Waste disposed is recorded through various means of measurement including estimation of weight by waste type. Particular waste types as described above are measured as a wet waste and converted to a bone dry (BD) weight. The wet waste weight is multiplied by the consistency of each waste type to determine the BD. The consistency is predetermined by the lab.

Baseline
71kg/T

Performance 2022

On Track

sustainable growth — APRIL Asia

Method

The DPTW utilisation rate and % of textile waste per tonne of product will be based on R&D lab/pilot/demo procedures.

Baseline
0%

Performance 2022

In Development

sustainable growth — APRIL Asia

Method

Water consumption per tonne of product is calculated based on water consumed in the production of saleable pulp, paper, viscose staple fiber and viscose yarn measured by flow meters, via calculation and water balances divided by the production figures for saleable pulp, paper, viscose staple fibre and viscose yarn.

Baseline
28 m3/T

Performance 2022

Not Progressing

sustainable growth — APRIL Asia

Method

Soda content within the liquor cycle and losses are determined by means of mass balance based on daily lab analysis.

Lime volume in the lime kiln and losses are determined by means of lime make-up.

The recovery rate is calculated net of the percentage of make-up amounts added. The annual figure is based on the average monthly recovery rate.

Baseline
96%

Performance 2022

Not Progressing

inclusive progress — APRIL Asia

Method

Number of Mill and Nursery contractor calculated based on Man Power data which grouped by gender level calculated as a monthly average.

Baseline
2571

inclusive progress — APRIL Asia

Method

The number of own and supply partners employees is calculated based on year-end Man Power data which is grouped by gender. The identification of leadership position refer to employees’ grade D2 or Manager level and above.

Baseline
55 women employees in leadership positions

Performance 2022

Progressing

inclusive progress — APRIL Asia

Method

Women’s effective participation is identified from the participation list for each program. Percentage of female participation is calculated by the number of women participating divided by the total participants.

Baseline
34%

Performance 2022

Progressing

inclusive progress — APRIL Asia

Method

In development

Baseline
In development

Performance 2022

Progressing

inclusive progress — APRIL Asia

Method

In development

Baseline
In development

Performance 2022

Progressing

inclusive progress — APRIL Asia

Method

In development

Baseline
In development

Performance 2022

Progressing

inclusive progress — APRIL Asia

Method

We engaged third party to conduct assessment in APRIL-supported schools using the framework that was developed by Research Triangle Institute (RTI) and USAID.

Baseline
In development

Performance 2022

Progressing

inclusive progress — APRIL Asia

Method

Poverty mapping is identified through:

  1. Desktop analysis using National Statistics, Village Potential Statistics, SMERU Poverty Map.
  2. On-the-ground verification through FGD, village transect walk, interview with community.

Baseline
3%

Performance 2022

Progressing

thriving landscapes — APRIL Asia

Method

Peer-reviewed scientific journal publication standards

Baseline
1

Performance 2022

On Track

thriving landscapes — APRIL Asia

Method

Documentation of Participation (presentation of papers or posters) in national and international dialogues, workshops and conferences

Baseline
6

Performance 2022

On Track

thriving landscapes — APRIL Asia

Method

Number of scientists from universities and research institutions that have collaborated with APRIL on peatland management during the calendar year

Baseline
9

Performance 2022

On Track

thriving landscapes — APRIL Asia

Method

Wood deliveries (excluding open market supply) to the mill are used as a basis to calculate MAI (Tonnes/ Ha/Yr). The MAI is based on the 3 year area weighted rolling average growth for all closed compartments.

Baseline
20T/ha/yr

Performance 2022

On Track

thriving landscapes — APRIL Asia

Method

Methodology to be developed specific to animal species and does not include plants. Qualifying initiatives may vary widely in nature but must have the animal protection as the primary objective.

Partnerships will be developed and documented in line with an overarching strategy prioritizing stakeholders and threats specific to the country of Indonesia assessed.

Performance 2022

Progressing

thriving landscapes — APRIL Asia

Method

May include various initiatives relating to conservation of RTE species to be defined in a priority list, initiatives may be conducted solely or in collaboration with other stakeholders.

Baseline
2

thriving landscapes — APRIL Asia

Method

Methodology to be developed to measure change in ecosystem services and values over time (carbon sequestration, water provision, resource provision including fish and honey)

Baseline
not yet developed

thriving landscapes — APRIL Asia

Method

Reports for reforestation of previously encroached and degraded area including all areas where assisted natural regeneration, planting or enrichment planting of species that improve habitat value have taken place during the year but excludes natural regeneration.

Baseline
275 ha

Performance 2022

Progressing

thriving landscapes — APRIL Asia

Method

Area within conservation is derived from land bank which is based on land cover analysis and is updated annually to capture any boundary changes, land use changes or measurement data.

Baseline
0 ha Net loss

Performance 2022

Not Progressing

thriving landscapes — APRIL Asia

Method

Landscape conservation funding includes restoration and conservation costs associated with the RER as well as the allocation of a proportion of the costs related to APRIL’s maintenance of conservation values under its production-protection model. The allocation is based on proportionate amount of each cost that is related to conservation and restoration.

The wood volume is based on wood delivered to the Mill.

Baseline
USD$0.7 per tonne of plantation fiber

Performance 2022

On Track

climate positive 1 — APRIL Asia

Method

Mill

Calculate from the records of fuel types used the amount consumed in boilers to generate power, heat and steam including energy use for mobile & including transportation. Each of the fuel types are converted to energy expressed by Giga Joule Lower Heating Value (GJ LHV) following the IPCC guidelines.

Baseline: 87%

Performance 2022

On Track

Forest Operations

Calculate from the records of fuel types the quantity consumed by major categories of forest management activities by Fiber operations.

This covers energy used for Forest operations, infrastructure including wood transport from estate to mill; When a blend of fuel types is used (such as B20) the contribution to renewable and cleaner energy targets is calculated separately for each fuel rather than considering the blend as a cleaner fuel type.

Baseline: 19%

Performance 2022

Progressing

climate positive 1 — APRIL Asia

Method

APRIL follows the international GHG protocol as developed by WRI/WBCSD to develop its emissions profile. The total emissions measured as emissions intensity is calculated based on tonnes of Scope 1 and 2 Mill Greenhouse Gas Emissions per tonne of product (paper, pulp and viscose). The emissions boundary scope covers gate-to-gate (wood processing in wood yard until pulp, paper and viscose production) of the three main GHGs: CO2, CH4, and N2O.

Baseline
0.55 tCO2e/product tonne

Performance 2022

On Track

climate positive 1 — APRIL Asia

Method

To quantify the total GHG emission and removals across APRIL’s land bank from land use, APRIL follows the GHG Protocol Agricultural Guidance and IPCC Guidelines for Agricultural, Forestry, and Other Land Use. To detect the land cover change within the look-back period, i.e. 20 years APRIL utilized the remotely sensed data.

The GHG emission will be calculated as the total of carbon stock changes in woody biomass and soil organic carbon and include all major carbon fluxes such as peat decomposition, plantation growth and harvesting, and fires.

To quantify the amount of carbon unit to balance the emission, the Verified Carbon Standard (VCS), the Climate, Community and Biodiversity Standards (CCB), or other internationally accepted standard will be used.

Performance 2022

Progressing

This site is registered on wpml.org as a development site. Switch to a production site key to remove this banner.