
インドネシア・リアウ州における火災防止の取り組みとして、コミュニティベースで実施されるファイヤー・フリー・ビレッジ・プログラムや地上の消火チームによる協力と即応態勢の整備、更に「空の目」に至るまで様々な形態が取られています。 

この最後のケースでは、「ホットスポット」を特定することが衛星とこれをモニターする人間の任務になっています。空の目という言葉自体、スマトラ半島の火災防止の取組みと同じ意味で俗に使われるようになりました。何千メートルもの上空から確認されたホットスポットが火災の脅威を示すものでないと判明することもよくありますが、火災ゼロの未来という公約のためにはあらゆる警戒信号を調査する必要があるのです。

ホットスポットや火災に関する管理の包括的なアプローチの一環として実施されているこのモニタリングがリアウ州を火災ゼロの状態に保つうえで如何に重要な役割を果たしているかについて、エイプリル社の防火担当責任者のクレイグ・トゥリボレット氏に伺いました。

ホットスポットは特定可能か

私たちはエイプリル社のコンセッション・エリア内の火災リスクの潜在性のモニタリングを支援するため、NASAの2つの異なったプラットフォームからのデータを使用しています。また当然、私たちの防火プログラムの他の要素とこれを併せています。

その機器の一つ、MODISはNASAのアクアとテラの衛星に搭載されています。MODISは気温が夜間摂氏37度、日中42度を超えたエリアを特定します。そうすると私たちの地上要員が半径1.1キロメートル内の火災の兆候を調べるのです。もう一つの最新プラットフォームであるVIIRSは、NASAのノア(NOOA)衛星に搭載され、可視赤外線を利用しています。これがスペクトル帯域内のホットスポットを特定すると、私たちの要員が半径375メートル内で現場測定を行います。衛星によってホットスポットを特定するのではなく、それを見つけるのに物理的な確認が必要となるエリアを特定するのに衛星を利用するということに注意することが重要です。

ホットスポットの特定に関わる技術および衛星運航者とは

先程の2つのNASAのプラットフォームから衛星画像が送られてきます。そして私たちのコンセッション・エリア上空を衛星が通過する約3時間毎にほぼリアルタイムのデータを送信するFIRMS(資源管理システムのための火災情報)というNASAのサービスを通じて、特定のホットスポットアルゴリズムを用いた分析がなされます。

ホットスポットのデータは、グローバル・フォレスト・ウォッチのウェブサイトもしくはアセアン・ヘイズ・オンラインマップなどで一般の人も見ることができます。

実際にモニタリングを行い、ホットスポットが特定されたかを知らせる主体とは

私たちのコンセッション・エリア内もしくはその付近の火災多発地帯を緯度/経度でプロットしたすべての最新のホットスポットのデータが毎朝衛星からダウンロードされ、送られてきます。

私たち独自の計画チームがそのデータを分析し、すべての緯度・経度情報をマップ上にプロットします。コンセッション・エリア内もしくはその付近に火災場所がある場合は、ホットスポットを一つ残らず現場測定することを任務とする個々の農園火災防止チームへそのデータが送られます。

ホットスポット警報を受け取る平均的回数とは

夏季は1日に2~3ダースもの警報があることがあります。他の時期にはまったくないこともあります。

回数が非常に多いときは、MODISにより特定されたホットスポットが半径1キロメートル内のどこかですので大変です。VIIRSでは375メートル内ですので少しは楽です。回数が非常に多いときは、ヘリコプターを使う方が火災場所を確認するのに楽です。結果的にトタン屋根、荷船、モスクだったことが判明する場合もよくあります。
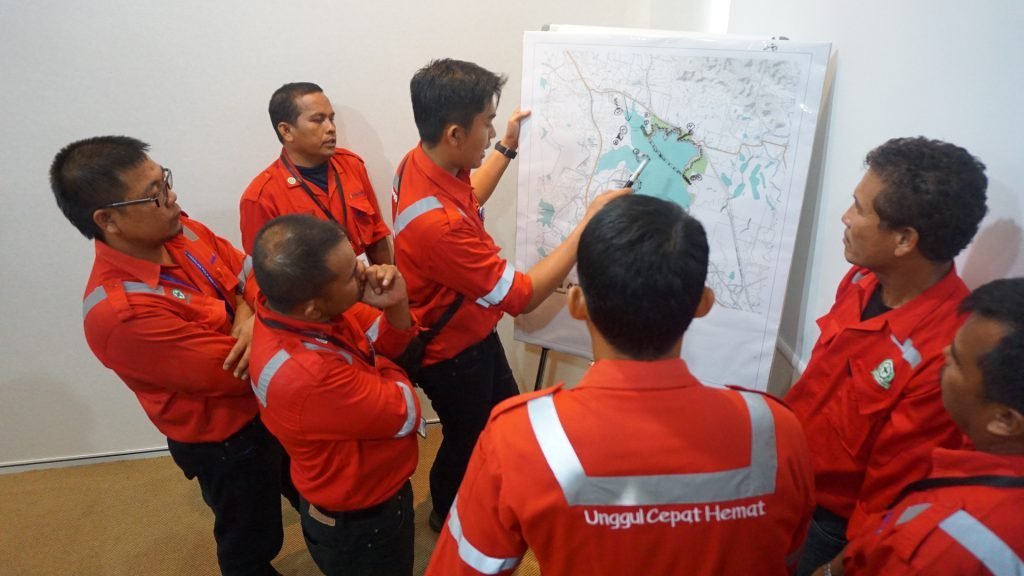
FireTeamDiscussion — APRIL Asia

司令室のエイプリル社消防チーム

ホットスポット警報が出されたときの一連の出来事とは

農園火災防止チームは計画チームからの情報に基づくホットスポットの場所を特定するためにGPSを使います。これが、私どもがデータに基づいて行動し、調査を行った証しとしても使われます。

現場測定のために農園から2、3時間車を走らせなければならないときもあります。険しい地帯や実に遠いエリアにおいては、景観を俯瞰するためにドローンも使います。エリアへのドライブの約5分ごとに空中からの全体像を入手でき、鮮明で信頼できる眺望を与えてくれるため、ドローンは極めて重要です。

火災防止チームは、火災の100%が人為的なものであることを念頭にリスク分析も行うことになっています。チームはやみくもに車を走らせているわけではありません。調査中はリスクの高いエリアを優先します―中でも、最近開墾されたり違法伐採が行われたりしたエリア、新たな農業開発地、道路や河川などのアクセスポイント、住宅などです。

晴れた日に火災を発見する場合、チームが視認したり煙の臭いを嗅いだりするのはそれほど難しいことではありません。火災のおそれがないことを検証するのに数時間かかることもよくあります。何かを発見するよりもそれは実際には難しいのです。

多数のホットスポット警報を受け始めると、ヘリコプターを上空に飛ばし、空から検証します。ホットスポットに火災の発生が確認されれば―様々な一連の行動が開始されます。

防火全体におけるホットスポットモニタリングの重要性とは

モニタリングは素早い対応を保証するために必要です。探知が早ければ早いほど、火災の規模が小さく制御も容易で安全になります。ですからホットスポットのようなほぼリアルタイムの遠隔探査ツールが非常に役立つ場合があります―特に、地上パトロールではアクセスが困難な遠方のエリアではそうです。これらのツールは定期的な地上と空中のパトロール、さらにコミュニティから私たちの24時間火災ホットラインに送られてくる情報を含むより広範なモニタリング・ツールキットの一部を構成しています。

火災だと判明するホットスポットの割合とは

現実にはホットスポットの約5%しか火災として記録されていません―その大半は、露出土壌、浅瀬のほかトタン屋根などの人工構築物のように熱しやすくなっている場所であることが多いのです。また、雲やスモークによっても衛星の火災の発見能力は著しく制限されることがあります。

とはいえ火災ゼロという私たちの目標に向け、ホットスポットのモニタリングは、探知の全体像の間違いなく重要な一部となっています。私たちが頼ることのできる防火ツールキットは一つではありません。私たちは調査やコミュニティの取組みを通じて地上で作業し、ドローンやヘリコプターを使い、さらに高く衛星やモニタリング技術を用いて防火に取り組んでいます。

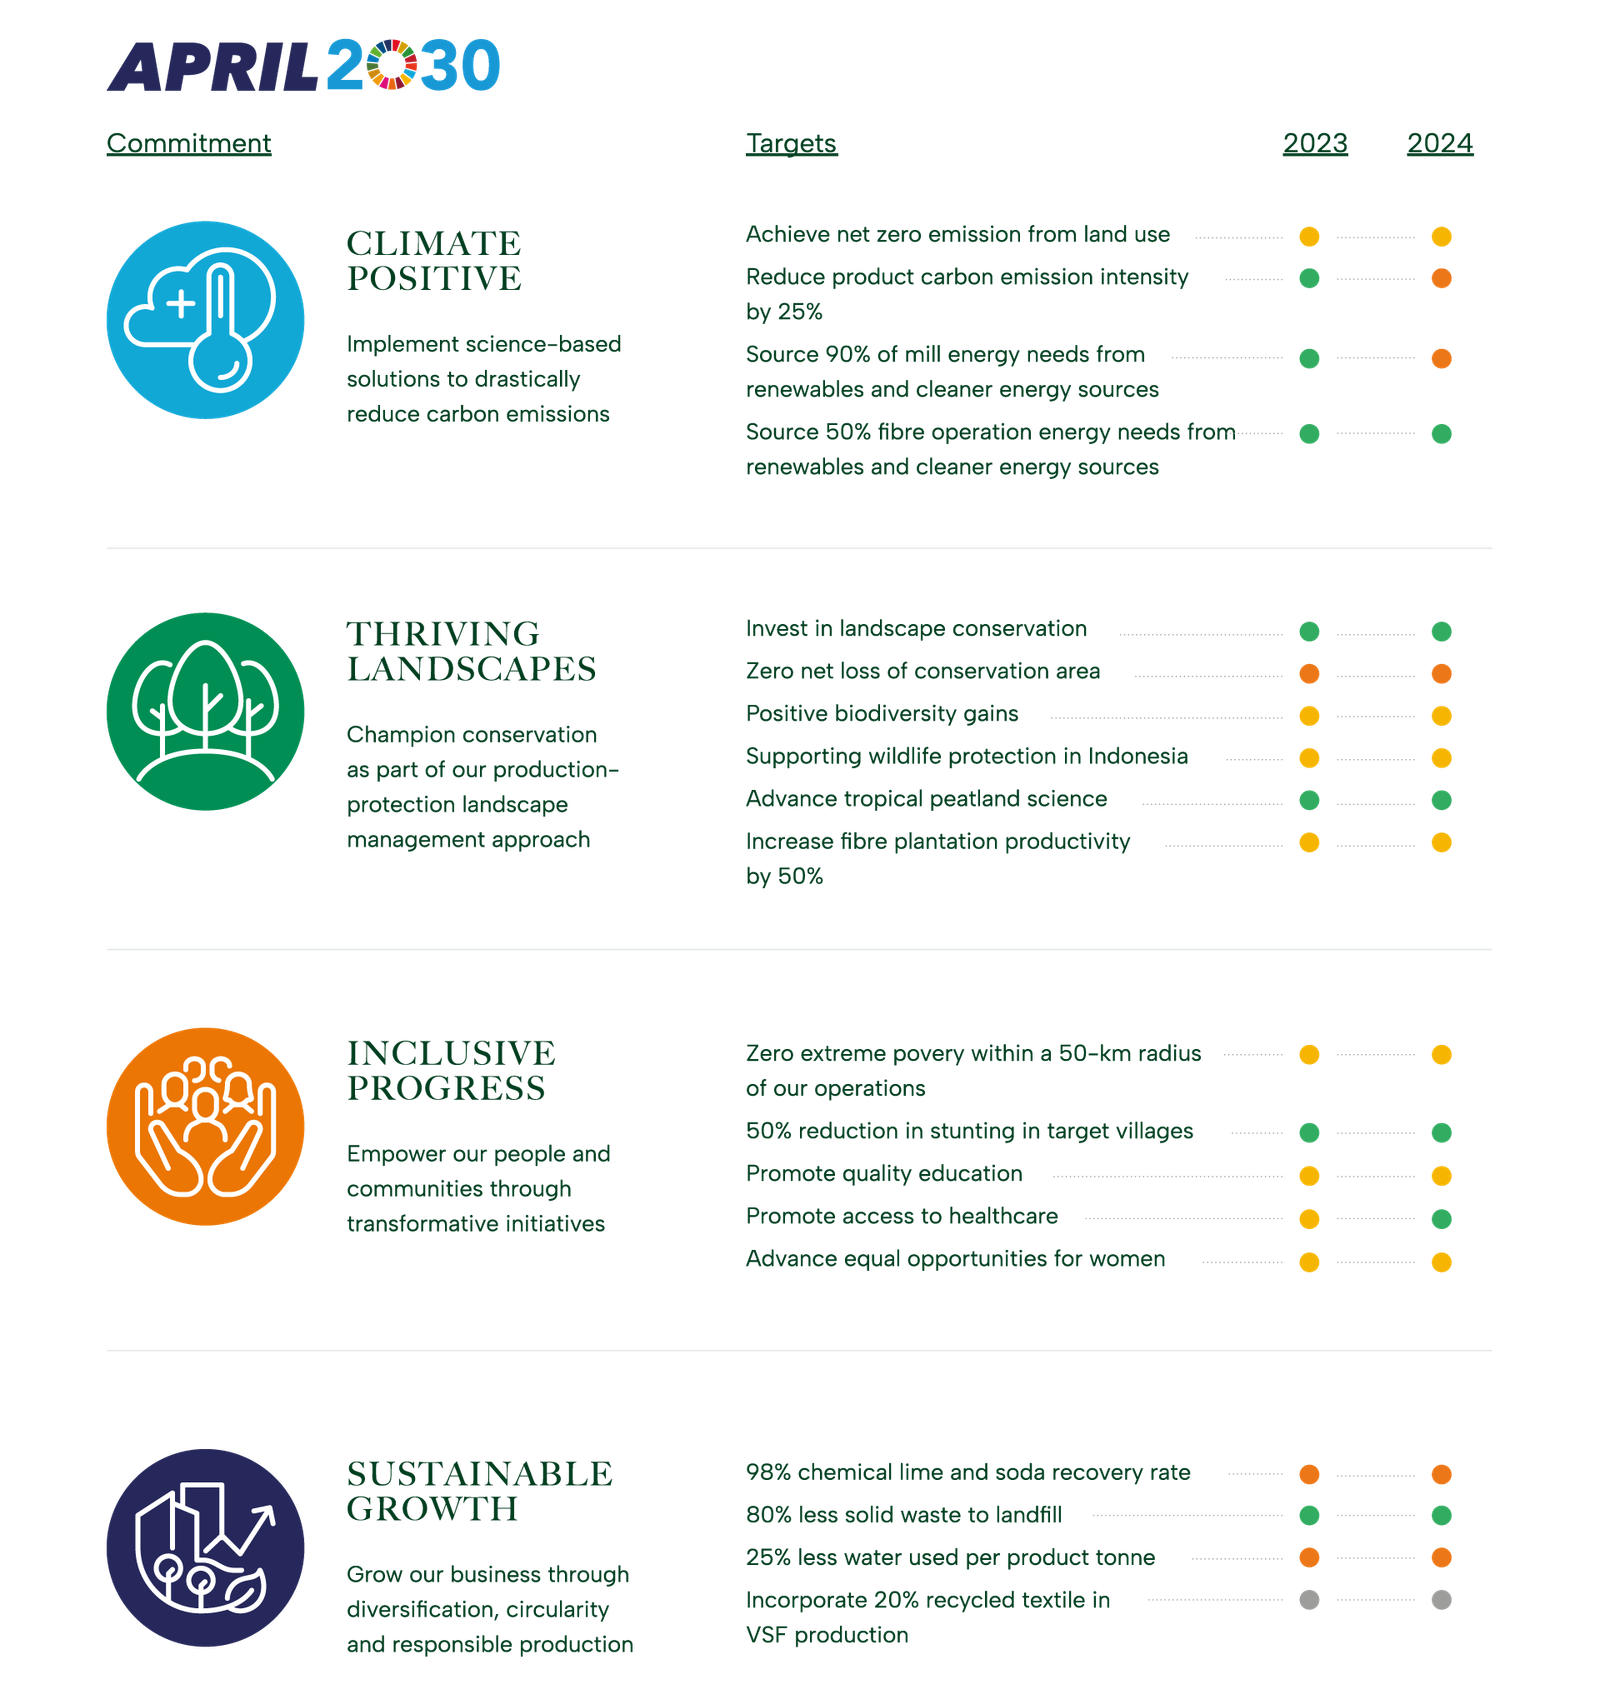
svg+xml;charset=utf — APRIL Asia
sustainable growth — APRIL Asia

Method

Waste disposed is recorded through various means of measurement including estimation of weight by waste type. Particular waste types as described above are measured as a wet waste and converted to a bone dry (BD) weight. The wet waste weight is multiplied by the consistency of each waste type to determine the BD. The consistency is predetermined by the lab.

Baseline
71kg/T

Performance 2022

On Track

sustainable growth — APRIL Asia

Method

The DPTW utilisation rate and % of textile waste per tonne of product will be based on R&D lab/pilot/demo procedures.

Baseline
0%

Performance 2022

In Development

sustainable growth — APRIL Asia

Method

Water consumption per tonne of product is calculated based on water consumed in the production of saleable pulp, paper, viscose staple fiber and viscose yarn measured by flow meters, via calculation and water balances divided by the production figures for saleable pulp, paper, viscose staple fibre and viscose yarn.

Baseline
28 m3/T

Performance 2022

Not Progressing

sustainable growth — APRIL Asia

Method

Soda content within the liquor cycle and losses are determined by means of mass balance based on daily lab analysis.

Lime volume in the lime kiln and losses are determined by means of lime make-up.

The recovery rate is calculated net of the percentage of make-up amounts added. The annual figure is based on the average monthly recovery rate.

Baseline
96%

Performance 2022

Not Progressing

inclusive progress — APRIL Asia

Method

Number of Mill and Nursery contractor calculated based on Man Power data which grouped by gender level calculated as a monthly average.

Baseline
2571

inclusive progress — APRIL Asia

Method

The number of own and supply partners employees is calculated based on year-end Man Power data which is grouped by gender. The identification of leadership position refer to employees’ grade D2 or Manager level and above.

Baseline
55 women employees in leadership positions

Performance 2022

Progressing

inclusive progress — APRIL Asia

Method

Women’s effective participation is identified from the participation list for each program. Percentage of female participation is calculated by the number of women participating divided by the total participants.

Baseline
34%

Performance 2022

Progressing

inclusive progress — APRIL Asia

Method

In development

Baseline
In development

Performance 2022

Progressing

inclusive progress — APRIL Asia

Method

In development

Baseline
In development

Performance 2022

Progressing

inclusive progress — APRIL Asia

Method

In development

Baseline
In development

Performance 2022

Progressing

inclusive progress — APRIL Asia

Method

We engaged third party to conduct assessment in APRIL-supported schools using the framework that was developed by Research Triangle Institute (RTI) and USAID.

Baseline
In development

Performance 2022

Progressing

inclusive progress — APRIL Asia

Method

Poverty mapping is identified through:

  1. Desktop analysis using National Statistics, Village Potential Statistics, SMERU Poverty Map.
  2. On-the-ground verification through FGD, village transect walk, interview with community.

Baseline
3%

Performance 2022

Progressing

thriving landscapes — APRIL Asia

Method

Peer-reviewed scientific journal publication standards

Baseline
1

Performance 2022

On Track

thriving landscapes — APRIL Asia

Method

Documentation of Participation (presentation of papers or posters) in national and international dialogues, workshops and conferences

Baseline
6

Performance 2022

On Track

thriving landscapes — APRIL Asia

Method

Number of scientists from universities and research institutions that have collaborated with APRIL on peatland management during the calendar year

Baseline
9

Performance 2022

On Track

thriving landscapes — APRIL Asia

Method

Wood deliveries (excluding open market supply) to the mill are used as a basis to calculate MAI (Tonnes/ Ha/Yr). The MAI is based on the 3 year area weighted rolling average growth for all closed compartments.

Baseline
20T/ha/yr

Performance 2022

On Track

thriving landscapes — APRIL Asia

Method

Methodology to be developed specific to animal species and does not include plants. Qualifying initiatives may vary widely in nature but must have the animal protection as the primary objective.

Partnerships will be developed and documented in line with an overarching strategy prioritizing stakeholders and threats specific to the country of Indonesia assessed.

Performance 2022

Progressing

thriving landscapes — APRIL Asia

Method

May include various initiatives relating to conservation of RTE species to be defined in a priority list, initiatives may be conducted solely or in collaboration with other stakeholders.

Baseline
2

thriving landscapes — APRIL Asia

Method

Methodology to be developed to measure change in ecosystem services and values over time (carbon sequestration, water provision, resource provision including fish and honey)

Baseline
not yet developed

thriving landscapes — APRIL Asia

Method

Reports for reforestation of previously encroached and degraded area including all areas where assisted natural regeneration, planting or enrichment planting of species that improve habitat value have taken place during the year but excludes natural regeneration.

Baseline
275 ha

Performance 2022

Progressing

thriving landscapes — APRIL Asia

Method

Area within conservation is derived from land bank which is based on land cover analysis and is updated annually to capture any boundary changes, land use changes or measurement data.

Baseline
0 ha Net loss

Performance 2022

Not Progressing

thriving landscapes — APRIL Asia

Method

Landscape conservation funding includes restoration and conservation costs associated with the RER as well as the allocation of a proportion of the costs related to APRIL’s maintenance of conservation values under its production-protection model. The allocation is based on proportionate amount of each cost that is related to conservation and restoration.

The wood volume is based on wood delivered to the Mill.

Baseline
USD$0.7 per tonne of plantation fiber

Performance 2022

On Track

climate positive 1 — APRIL Asia

Method

Mill

Calculate from the records of fuel types used the amount consumed in boilers to generate power, heat and steam including energy use for mobile & including transportation. Each of the fuel types are converted to energy expressed by Giga Joule Lower Heating Value (GJ LHV) following the IPCC guidelines.

Baseline: 87%

Performance 2022

On Track

Forest Operations

Calculate from the records of fuel types the quantity consumed by major categories of forest management activities by Fiber operations.

This covers energy used for Forest operations, infrastructure including wood transport from estate to mill; When a blend of fuel types is used (such as B20) the contribution to renewable and cleaner energy targets is calculated separately for each fuel rather than considering the blend as a cleaner fuel type.

Baseline: 19%

Performance 2022

Progressing

climate positive 1 — APRIL Asia

Method

APRIL follows the international GHG protocol as developed by WRI/WBCSD to develop its emissions profile. The total emissions measured as emissions intensity is calculated based on tonnes of Scope 1 and 2 Mill Greenhouse Gas Emissions per tonne of product (paper, pulp and viscose). The emissions boundary scope covers gate-to-gate (wood processing in wood yard until pulp, paper and viscose production) of the three main GHGs: CO2, CH4, and N2O.

Baseline
0.55 tCO2e/product tonne

Performance 2022

On Track

climate positive 1 — APRIL Asia

Method

To quantify the total GHG emission and removals across APRIL’s land bank from land use, APRIL follows the GHG Protocol Agricultural Guidance and IPCC Guidelines for Agricultural, Forestry, and Other Land Use. To detect the land cover change within the look-back period, i.e. 20 years APRIL utilized the remotely sensed data.

The GHG emission will be calculated as the total of carbon stock changes in woody biomass and soil organic carbon and include all major carbon fluxes such as peat decomposition, plantation growth and harvesting, and fires.

To quantify the amount of carbon unit to balance the emission, the Verified Carbon Standard (VCS), the Climate, Community and Biodiversity Standards (CCB), or other internationally accepted standard will be used.

Performance 2022

Progressing

This site is registered on wpml.org as a development site. Switch to a production site key to remove this banner.