search

Fire prevention in Indonesia’s Riau province takes on many forms – from the community-based Fire Free Village Programme and the collaboration and responsiveness of fire suppression teams on the ground to the vital contribution of unseen eyes in the sky. 

In the latter case, it’s the job of satellites and those who monitor them to identify ‘hotspots’. The term itself has become synonymous with efforts to prevent fires in Sumatra, entering into common parlance. And while it often happens that a hotspot identified from thousands of meters up turns out not to indicate a fire threat –the commitment to a fire-free future means that every warning sign must be investigated.

We spoke to APRIL Fire Prevention Manager Craig Tribolet about hotspots and how monitoring them as part of a comprehensive approach to fire management plays an important role in keeping Riau fire-free.

Can you define a hotspot?

We use satellite data from two separate NASA-based platforms to help monitor potential fire risk within the APRIL concessions; obviously along with other elements of our fire prevention program.

One of the instruments, MODIS, is on NASA’s AQUA and TERRA satellites. The instrument identifies any area where the temperature has reached more than 37 degrees C at night or 42 degrees C during the day. Our ground crews will then look for signs of fire within a 1.1km radius. The other more recent platform, VIIRS, is on board a NASA/NOAA satellite and uses visible infrared. When this identifies a hotspot within a spectral band, our crews ground-truth within a 375m radius. It’s important to note that the satellites don’t literally pick up a spot, they identify an area which has to be physically checked to find out where the actual hotspot is.

What kind of technology is involved in identifying hotspots and who operates the satellites?

The satellite based imaging comes from the two NASA-based platforms and is analyzed with specific hotspot algorithms via a NASA service called Fire Information for Resource Management System (FIRMS) which sends out the near real-time data within about three hours of the satellite passing over our concessions.

Hotspot data can easily be viewed by the general public using platforms like the Global Forest Watch website or the ASEAN Haze Online maps.

Who does the actual monitoring and lets you know if a hotspot has been identified?

Every morning we get a satellite download which includes all the recent hotspot data with a latitude/longitude plotting any hotspots within or adjacent to our concessions.

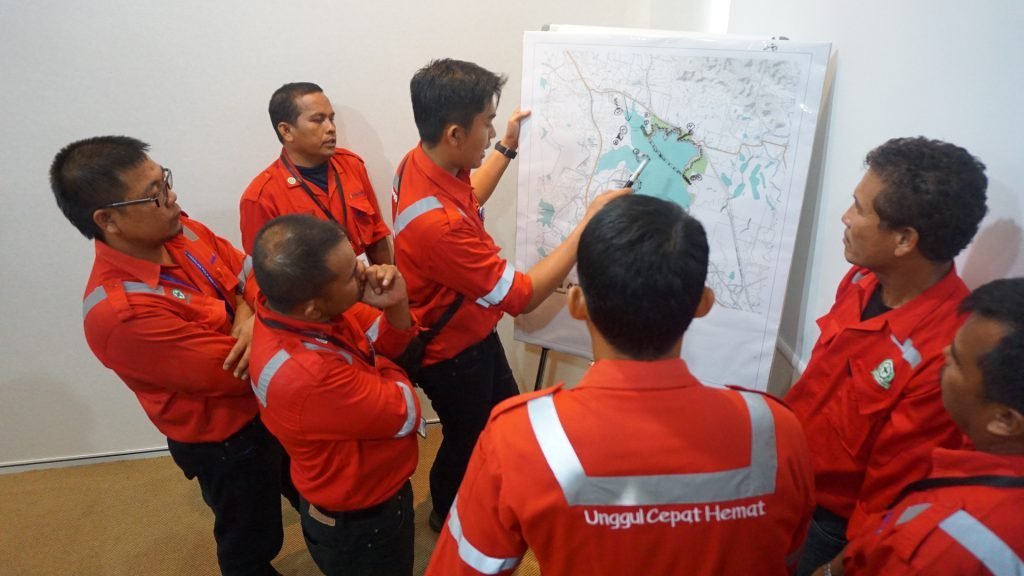
Our own Planning team analyses the data and plots all the latitude and longitude information on a map. Any spot that falls within or adjacent to our concessions is sent out to those individual Estate Fire and Protection Teams who are then tasked with ground-truthing each and every one of those hotspots.

On average how many hotspot alerts do you receive?

During the summer we can have maybe two or three dozen hotspots in a day. At other times we can also have none.

When we have a very large number, it’s a challenge because a hotspot identified by MODIS can be anywhere within a kilometer radius; with VIIRS it’s somewhat easier because it’s 375 meters. When it’s a very large number, we use a helicopter and it’s quite easy to check out some of them; often it turns out to be a tin roof or a barge or a mosque.

FireTeamDiscussion — APRIL Asia

APRIL Fire Suppression Team at the Control Room

What’s the chain of events once a hotspot alert goes out?

The Estate Fire and Protection teams use a GPS to locate the hotspot based on the information from the Planning team. This is also used as evidence that we have acted on the data and undertaken an inspection.

Sometimes we need to drive a couple of hours from the estate to ground truth an area. In difficult terrain or really remote areas they will also use a drone to get an overview of the landscape. The drones are quite important because we can get one in the air within about five minutes of driving to an area and a drone can give us a pretty reliable view.

The Fire teams will also do a risk analysis bearing in mind that 100% of fires are human caused; the teams don’t just drive around blindly hoping they are going to come across a hotspot. So they prioritize high risk areas during their inspections – recent clearing or areas of illegal logging, new agricultural development, access points like roads and rivers, houses amongst other factors.

On a clear day, in looking for a fire it’s not too hard for the teams to see or smell smoke. It often can take us a few hours to verify that there is no threat which actually is harder than finding something.

When you start getting dozens of hotspot alerts, that’s when we’ll put the helicopter up to verify from the air. Of course there’s a different chain of events that kicks in if a hotspot is confirmed as a fire.

How important is this hotspot monitoring in the overall prevention of fires?

Monitoring is critical to ensure rapid response – the earlier the detection, the smaller the fire and the easier and safer to control. So near real time remote sensing tools like Hotspots can be very useful – particularly in remote areas that ground patrols may struggle to access. They form part of a broader monitoring toolkit that includes regular ground and air patrols as well as information sent from communities to our 24hr  Fire Hotline.

What percentage of hotspots turns out to be fires?

The reality is that only about 5% of hotspots are ever recorded as fires – the bulk of them tend to be locations in the landscape that have heated up like bare soil, shallow water as well as human structures like tin roofs. Also, cloud and smoke can seriously limit the ability of the satellite to see fires.

But having said that, monitoring for hotspots is an absolutely vital part of the overall detection picture because our goal is zero fires. There’s not one element of our fire prevention toolkit that we can exclusively rely on. We work on the ground through inspections and community initiatives, we work with drones and helicopters, and then we work much higher up with satellites and monitoring technology.

svg+xml;charset=utf — APRIL Asia
sustainable growth — APRIL Asia

Method

Waste disposed is recorded through various means of measurement including estimation of weight by waste type. Particular waste types as described above are measured as a wet waste and converted to a bone dry (BD) weight. The wet waste weight is multiplied by the consistency of each waste type to determine the BD. The consistency is predetermined by the lab.

Baseline
71kg/T

Performance 2022

On Track

sustainable growth — APRIL Asia

Method

The DPTW utilisation rate and % of textile waste per tonne of product will be based on R&D lab/pilot/demo procedures.

Baseline
0%

Performance 2022

In Development

sustainable growth — APRIL Asia

Method

Water consumption per tonne of product is calculated based on water consumed in the production of saleable pulp, paper, viscose staple fiber and viscose yarn measured by flow meters, via calculation and water balances divided by the production figures for saleable pulp, paper, viscose staple fibre and viscose yarn.

Baseline
28 m3/T

Performance 2022

Not Progressing

sustainable growth — APRIL Asia

Method

Soda content within the liquor cycle and losses are determined by means of mass balance based on daily lab analysis.

Lime volume in the lime kiln and losses are determined by means of lime make-up.

The recovery rate is calculated net of the percentage of make-up amounts added. The annual figure is based on the average monthly recovery rate.

Baseline
96%

Performance 2022

Not Progressing

inclusive progress — APRIL Asia

Method

Number of Mill and Nursery contractor calculated based on Man Power data which grouped by gender level calculated as a monthly average.

Baseline
2571

inclusive progress — APRIL Asia

Method

The number of own and supply partners employees is calculated based on year-end Man Power data which is grouped by gender. The identification of leadership position refer to employees’ grade D2 or Manager level and above.

Baseline
55 women employees in leadership positions

Performance 2022

Progressing

inclusive progress — APRIL Asia

Method

Women’s effective participation is identified from the participation list for each program. Percentage of female participation is calculated by the number of women participating divided by the total participants.

Baseline
34%

Performance 2022

Progressing

inclusive progress — APRIL Asia

Method

In development

Baseline
In development

Performance 2022

Progressing

inclusive progress — APRIL Asia

Method

In development

Baseline
In development

Performance 2022

Progressing

inclusive progress — APRIL Asia

Method

In development

Baseline
In development

Performance 2022

Progressing

inclusive progress — APRIL Asia

Method

We engaged third party to conduct assessment in APRIL-supported schools using the framework that was developed by Research Triangle Institute (RTI) and USAID.

Baseline
In development

Performance 2022

Progressing

inclusive progress — APRIL Asia

Method

Poverty mapping is identified through:

  1. Desktop analysis using National Statistics, Village Potential Statistics, SMERU Poverty Map.
  2. On-the-ground verification through FGD, village transect walk, interview with community.

Baseline
3%

Performance 2022

Progressing

thriving landscapes — APRIL Asia

Method

Peer-reviewed scientific journal publication standards

Baseline
1

Performance 2022

On Track

thriving landscapes — APRIL Asia

Method

Documentation of Participation (presentation of papers or posters) in national and international dialogues, workshops and conferences

Baseline
6

Performance 2022

On Track

thriving landscapes — APRIL Asia

Method

Number of scientists from universities and research institutions that have collaborated with APRIL on peatland management during the calendar year

Baseline
9

Performance 2022

On Track

thriving landscapes — APRIL Asia

Method

Wood deliveries (excluding open market supply) to the mill are used as a basis to calculate MAI (Tonnes/ Ha/Yr). The MAI is based on the 3 year area weighted rolling average growth for all closed compartments.

Baseline
20T/ha/yr

Performance 2022

On Track

thriving landscapes — APRIL Asia

Method

Methodology to be developed specific to animal species and does not include plants. Qualifying initiatives may vary widely in nature but must have the animal protection as the primary objective.

Partnerships will be developed and documented in line with an overarching strategy prioritizing stakeholders and threats specific to the country of Indonesia assessed.

Performance 2022

Progressing

thriving landscapes — APRIL Asia

Method

May include various initiatives relating to conservation of RTE species to be defined in a priority list, initiatives may be conducted solely or in collaboration with other stakeholders.

Baseline
2

thriving landscapes — APRIL Asia

Method

Methodology to be developed to measure change in ecosystem services and values over time (carbon sequestration, water provision, resource provision including fish and honey)

Baseline
not yet developed

thriving landscapes — APRIL Asia

Method

Reports for reforestation of previously encroached and degraded area including all areas where assisted natural regeneration, planting or enrichment planting of species that improve habitat value have taken place during the year but excludes natural regeneration.

Baseline
275 ha

Performance 2022

Progressing

thriving landscapes — APRIL Asia

Method

Area within conservation is derived from land bank which is based on land cover analysis and is updated annually to capture any boundary changes, land use changes or measurement data.

Baseline
0 ha Net loss

Performance 2022

Not Progressing

thriving landscapes — APRIL Asia

Method

Landscape conservation funding includes restoration and conservation costs associated with the RER as well as the allocation of a proportion of the costs related to APRIL’s maintenance of conservation values under its production-protection model. The allocation is based on proportionate amount of each cost that is related to conservation and restoration.

The wood volume is based on wood delivered to the Mill.

Baseline
USD$0.7 per tonne of plantation fiber

Performance 2022

On Track

climate positive 1 — APRIL Asia

Method

Mill

Calculate from the records of fuel types used the amount consumed in boilers to generate power, heat and steam including energy use for mobile & including transportation. Each of the fuel types are converted to energy expressed by Giga Joule Lower Heating Value (GJ LHV) following the IPCC guidelines.

Baseline: 87%

Performance 2022

On Track

Forest Operations

Calculate from the records of fuel types the quantity consumed by major categories of forest management activities by Fiber operations.

This covers energy used for Forest operations, infrastructure including wood transport from estate to mill; When a blend of fuel types is used (such as B20) the contribution to renewable and cleaner energy targets is calculated separately for each fuel rather than considering the blend as a cleaner fuel type.

Baseline: 19%

Performance 2022

Progressing

climate positive 1 — APRIL Asia

Method

APRIL follows the international GHG protocol as developed by WRI/WBCSD to develop its emissions profile. The total emissions measured as emissions intensity is calculated based on tonnes of Scope 1 and 2 Mill Greenhouse Gas Emissions per tonne of product (paper, pulp and viscose). The emissions boundary scope covers gate-to-gate (wood processing in wood yard until pulp, paper and viscose production) of the three main GHGs: CO2, CH4, and N2O.

Baseline
0.55 tCO2e/product tonne

Performance 2022

On Track

climate positive 1 — APRIL Asia

Method

To quantify the total GHG emission and removals across APRIL’s land bank from land use, APRIL follows the GHG Protocol Agricultural Guidance and IPCC Guidelines for Agricultural, Forestry, and Other Land Use. To detect the land cover change within the look-back period, i.e. 20 years APRIL utilized the remotely sensed data.

The GHG emission will be calculated as the total of carbon stock changes in woody biomass and soil organic carbon and include all major carbon fluxes such as peat decomposition, plantation growth and harvesting, and fires.

To quantify the amount of carbon unit to balance the emission, the Verified Carbon Standard (VCS), the Climate, Community and Biodiversity Standards (CCB), or other internationally accepted standard will be used.

Performance 2022

Progressing

This site is registered on wpml.org as a development site. Switch to a production site key to remove this banner.