APRIL has responded to a series of questions received from Greenpeace based on its analysis of alleged fires and burnt areas in APRIL concessions between 2015 and 2019. These will inform a forthcoming report. Our response to Greenpeace updates the comprehensive reply we provided to Greenpeace for its report on the same subject in September 2019 and includes fire data from the past year.
Based on field-verified data, we disagree with Greenpeace’s claim that 10,220 hectares were burnt in APRIL’s and our suppliers’ concessions in 2019. The total fire area in APRIL’s and supply partners’ concessions in 2019 is verified as 30 hectares while the total for 2015 to 2019 period is verified as 1,912 hectares.
As background, we note that in October 2018 APRIL shared files of our concession maps with Greenpeace, covering our supply partners and also some of our open market suppliers. We also provide concession maps to the World Resources Institute on an annual basis to support its Global Forest Watch monitoring platform. Concession maps of our supply chain are also publicly available on our Sustainability Dashboard.
The Facts on Fire
In our response to Greenpeace we took the opportunity to again explain the reasons for the gap between APRIL’s ground-truthed data and Greenpeace’s numbers from its own analysis. Our response is supported by detailed examples based on Landsat 7 and 8 imagery.
In September 2019, we advised Greenpeace of a total burnt area of 1,304 hectares across APRIL and supplier concessions between 2015 and 2018, against a total of 55,600 hectares it had identified as burnt area. Two examples that contributed to this discrepancy are supplier PT SRL, where fires were confirmed to have affected 757 hectares while Greenpeace’s report noted 14,700 hectares; and supplier PT SSL, which had 112 hectares verified as burnt during the period while Greenpeace reported 11,600 hectares.
The following table summarises the verified fire incidents in APRIL and supplier concessions:
[table “1” not found /]
As we noted in our September 2019 response, APRIL has identified technical and procedural issues that could result in the overestimation of fire data in Greenpeace’s figures:
- Plantation harvesting operations will often be recorded as burnt area as the automatic analysis cannot differentiate between harvesting and burning.
- None of the data analyzed by Greenpeace have been ground-truthed which is a critical standard practice in order to identify, verify and correct remote sensing analysis.
- Cloud cover and cloud shadow seriously affect the interpretative power of any remote imagery by either blocking or shadowing the ground. This is a particular issue when any automatic analysis is applied.
- Hotspots are proven to be an insufficient and unreliable fire detection and reporting methodology in the humid tropics. APRIL ground-truths 100% of hotspots within or adjacent to our concessions and we know from years of field verification that more than 90% of reported hotspots are not fires.
The following Landsat images are examples of areas identified as burnt in Greenpeace’s analysis that were in fact plantation harvesting operations and not related to any burning activity. These detailed Landsat 7 and 8 images of operational areas support APRIL’s analysis, along with field verification. We have offered Greenpeace the opportunity to ground-truth any of the claimed burnt areas and can provide further technical clarification if needed.
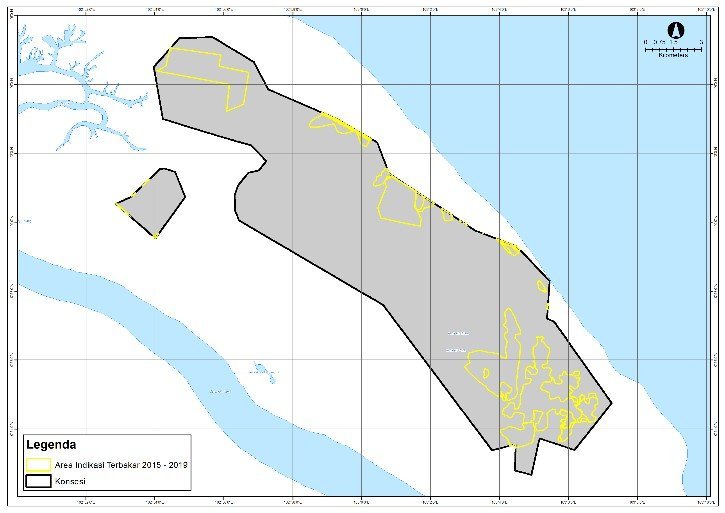
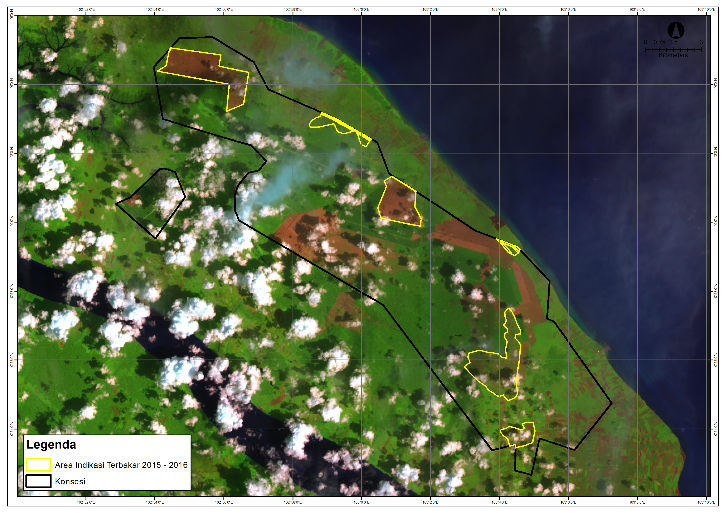
PT. RAPP Langgam
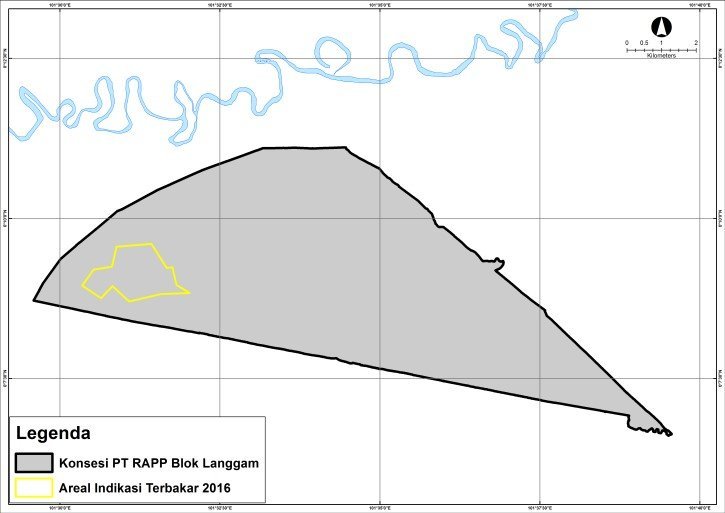
Concession and indicated burned areas
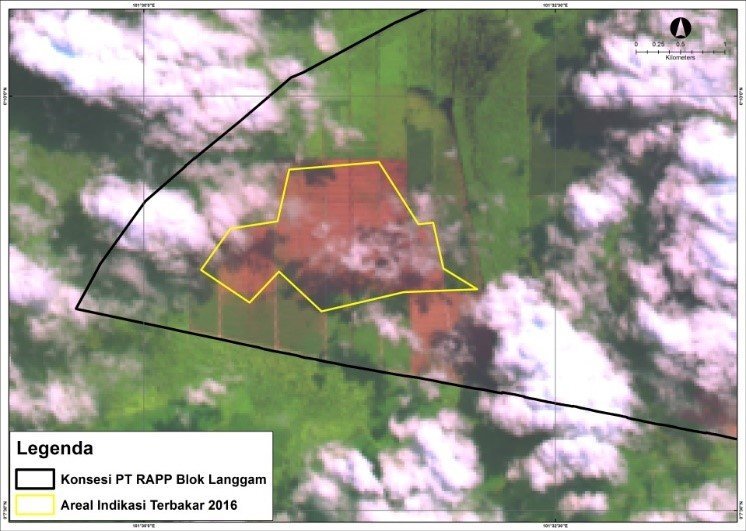
Landsat image as at 24 June 2015 clearly showing plantation harvesting activity
PT Sumatera Riang Lestari Blok V Sector Rangsang
Concession and indicated burned area
Landsat image as at 3 February 2016 clearly showing plantation harvesting activity
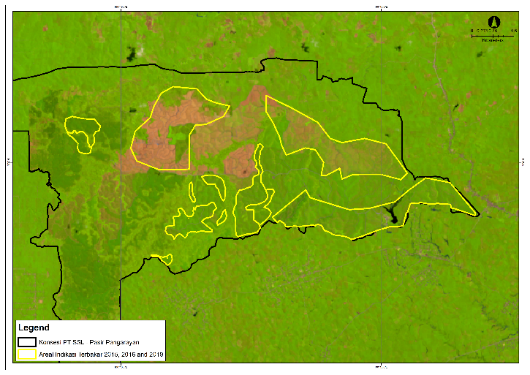
PT Sumatera Sylva Lestari – Pasar Pangarayan
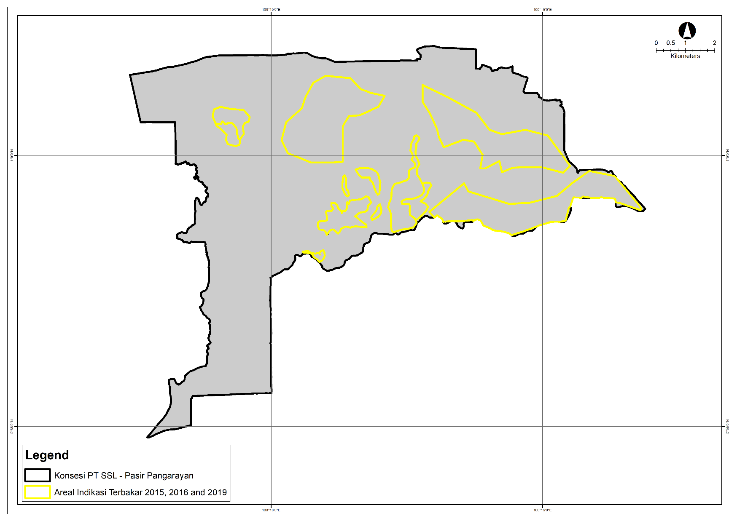
Concession and indicated burned areas
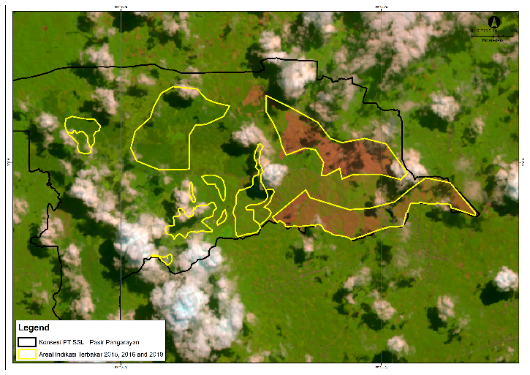
Landsat image as at 30 May 2015 clearly showing plantation harvesting activity
Landsat image as at 14 APRIL 2016 clearly showing second rotation plantation planting and growth
Fire-related Sanctions
APRIL confirms the following fire-related administrative sanctions issued by the government during the period from 2015 to 2019 (see Table 2). These sanctions were administrative in nature, requiring actions to be taken to strengthen compliance with Government regulations, and not criminal offences. The sanctions covered a range of land management issues, including illegal fires from encroachment and community development activities.
[table “2” not found /]APRIL’s Fire Management Approach
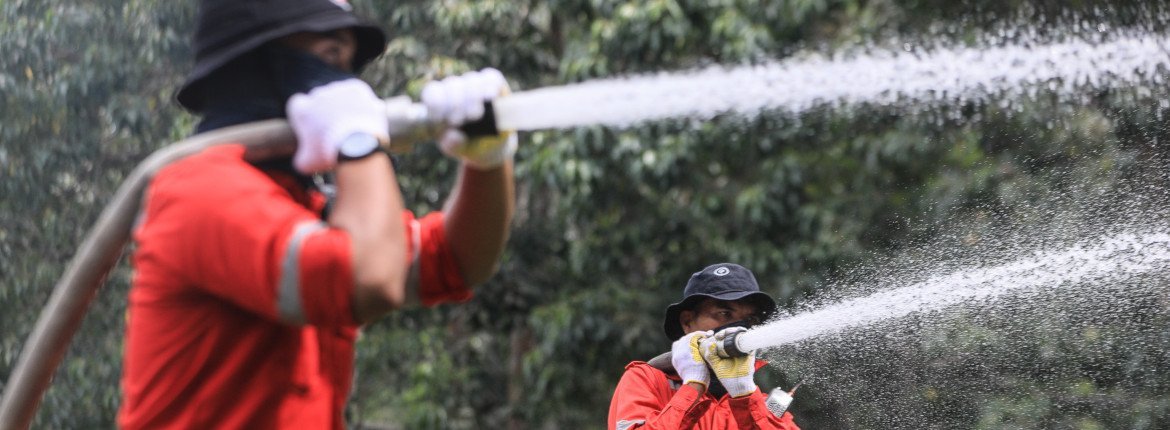
APRIL is the only company in Riau province to declare an annual Fire Danger Period from 1 July to 30 September across our concessions and those of our supply partners. This is an important tool in our broader fire management strategy to Prevent, Prepare, Respond and Restore which is specifically focused on reducing the impact of fires and haze.
Fire prevention is critical and the flagship Fire Free Village Program (FFVP) works closely with local communities to replace the need for fire as a land management tool. As of December 31, 2019, the total land area covered by the FFVP – through partnerships with almost 80 communities – was 753,604 hectares, an area almost ten times the size of Singapore. Over the period 2014-2019, the FFVP helped to reduce the impacts of unmanaged fire and haze by as much as 90%.
We continue to invest significantly in fire suppression resources – over US$9 million to date – and use advance satellite hotspot monitoring from two NASA-based systems – NOAA and MODIS satellites that indicate a thermal anomaly within a 1.1km² area – which complement our fire monitoring towers and CCTV. APRIL has three 30-metre fire monitoring towers, 50 18-meter towers and 50 65-meter CCTV towers. As a pre-emptive measure, we also respond to fires up to 3 km outside our concessions and support the local government’s fire suppression activities.
We agree that fire is a key threat to forests and lives and we will continue to support the Indonesian Government, the local communities and other stakeholders in addressing this challenge.