search

APRIL has responded to a series of questions received from Auriga Nusantara related to one of APRIL’s open market suppliers of plantation fiber, PT. Adindo Hutani Lestari (PT. AHL).

Auriga’s questions pertained to allegations of deforestation or loss of natural forest in PT AHL’s concession between 2015 and 2020 in breach of APRIL’s Sustainable Forest Management Policy 2.0 (SFMP 2.0), which applies to APRIL’s fiber supply chain. Auriga also raised questions of undeclared links in the shareholder structure of PT AHL and APRIL and APRIL’s parent company RGE.

In our response to Auriga, we shared comprehensive evidence to show no deforestation occurred in the areas Auriga made claims about and that there has been no breach of our SFMP 2.0 commitments. We also shared with Auriga a response from PT AHL to APRIL about claims of related ownership structure between APRIL or RGE and PT. AHL.

Deforestation and SFMP Violation Claims

As Auriga’s correspondence with APRIL notes, PT. AHL completed the requirements of a HCV assessment in February 2014 and an Executive Summary, including maps as shown below (Maps 1 – 4), is available on our Sustainability Dashboard (AHL HCV).

AHL Sebakis HCV mapping 2014 — APRIL Asia

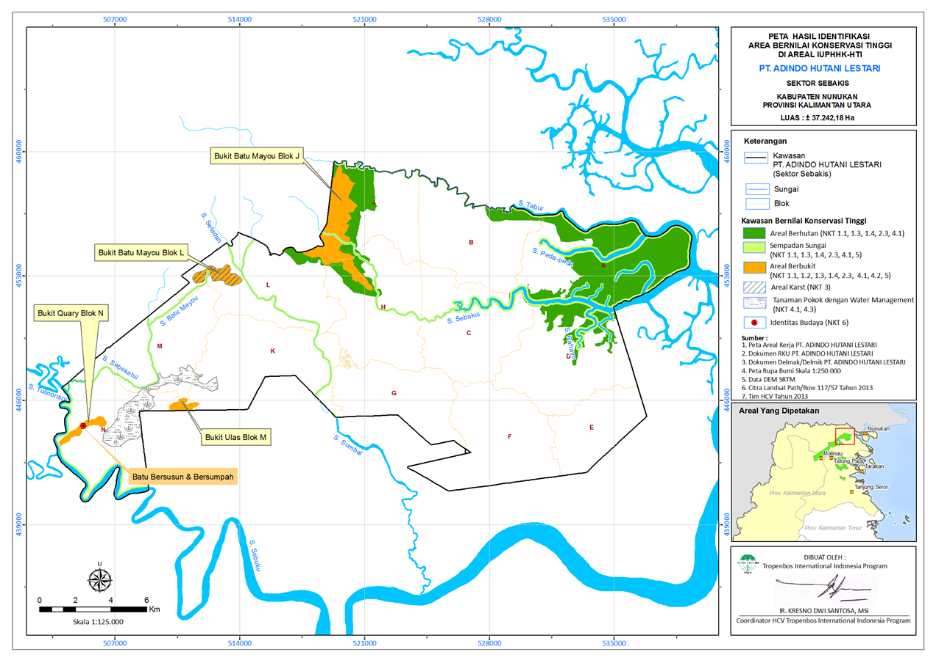
Map 1. AHL Sebakis HCV mapping (2014)

AHL Sembakung HCV mapping 2014 — APRIL Asia

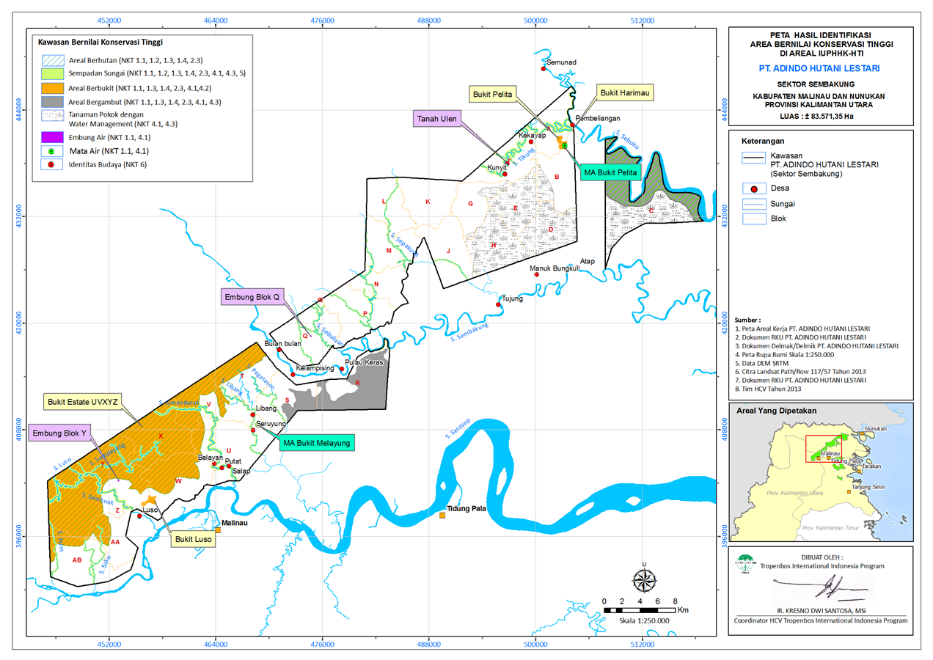
Map 2. AHL Sembakung HCV mapping (2014)

AHL Sesayap HCV Mapping 2014 — APRIL Asia

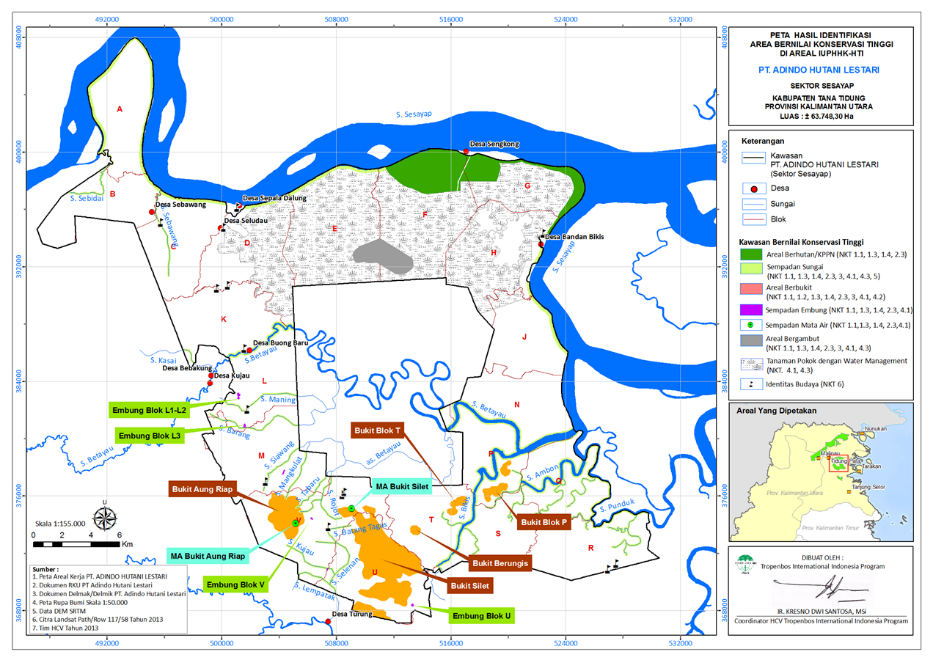
Map 3. AHL Sesayap HCV Mapping (2014)

AHL Sesayap Bengara HCV Mapping 2014 — APRIL Asia

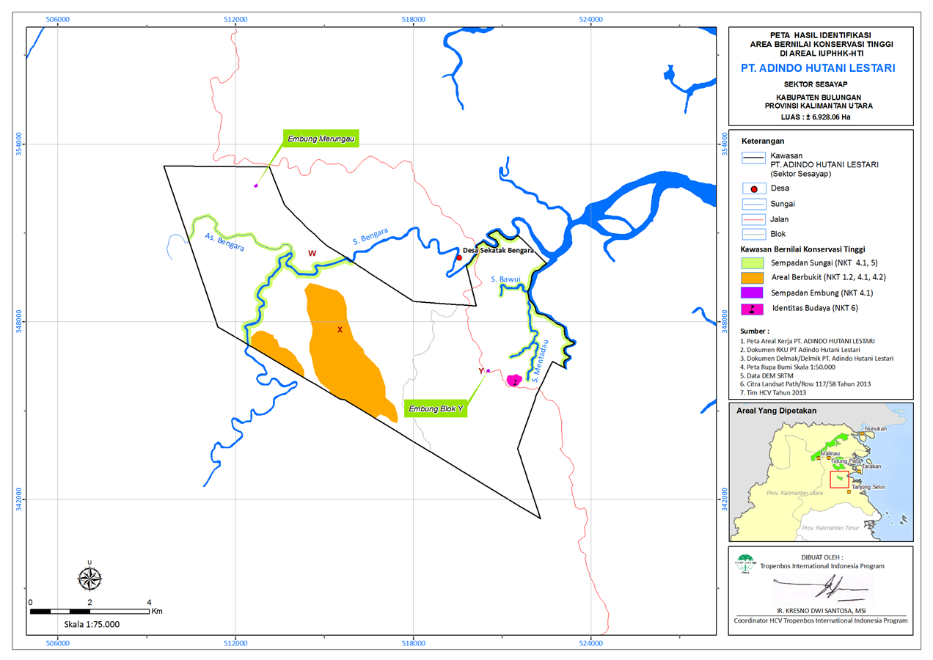
Map 4. AHL Sesayap Bengara HCV Mapping (2014)

It is important to note that based on these HCV results, PT AHL now conserves 89,181 hectares or 47% of its total concession area. This is almost double the area developed into plantations which total 50,388 hectares or only 26% of the concession area. This translates to a very high conservation to plantation ratio of 1.8:1.

We take any claims of deforestation seriously, and after investigation, including ground-truthing, we can confirm that no deforestation or breach of our SFMP 2.0 policy commitment has occurred. The facts are:

  • Between 3 June 2015 and 31 August 2020, 8,387 hectares of plantations were established in PT. AHL. None of these are located in identified HCV areas. This is proven by an analysis of the original HCV maps and a comparison of the maps showing the HCV and conservation areas in 2015 and in 2020 based on remote sensing analysis (see Map 5 Comparative Forest Cover 2015 – 2020).
  • Land preparation activities for all of the 8,387 hectares of plantations were completed before 15 May 2015, as independently verified by PT. Hatfield Indonesia, an environmental consultant with expertise in remote sensing. Hatfield’s analysis confirmed these areas were non-HCV areas and harvested prior to the 15 May 2015 cut-off date per APRIL’s SFMP 2.0. Please refer to Pictures 1 – 4 below for reference.
  • Of the 8,387 hectares 6,058 hectares are classified as peat and none of these are on a protected Peat Dome Peak Area (MOEF FEG Map SK.130/2017).
  • As with all of our fiber suppliers, PT. AHL is subject to an annual internal due diligence process and independent assurance by KPMG as part of our SFMP commitments. The KPMG audit reports are publicly available (KPMG). PT AHL is also subject to APRIL’s Land Cover Change monitoring system which analyzes monthly Land Sat data for any changes in forest cover.
  • As noted by Auriga in their letter to APRIL, the plantation establishment activities during the period from 3 June 2015 to 31 August 2020 are in compliance with Indonesian laws and regulations and in line with APRIL’s SFMP 2.0 commitments and HCV guidance.
Map 5.1 — APRIL Asia
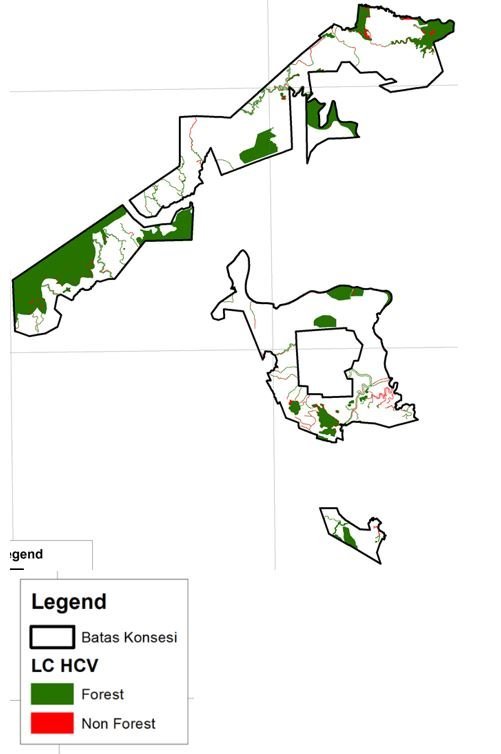
Natural Forest Cover, June 2015
Map 5.2 — APRIL Asia
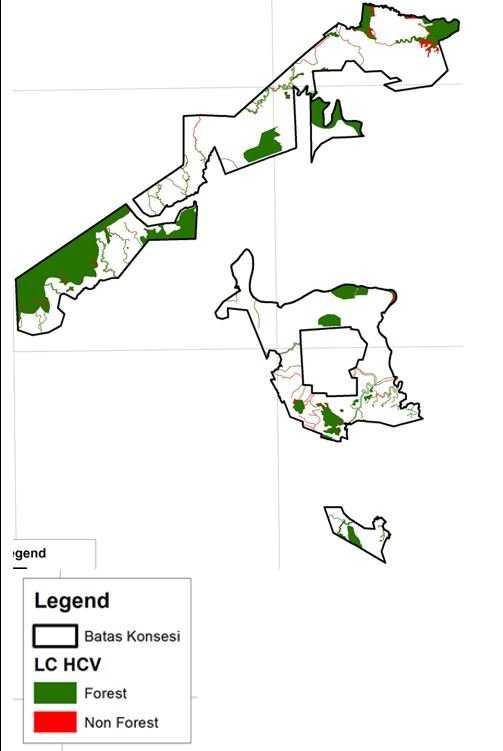
Natural Forest Cover, August 2020
Map 5. Comparative Forest Cover 2015 to 2020

Picture 1 Aerial Survey — APRIL Asia

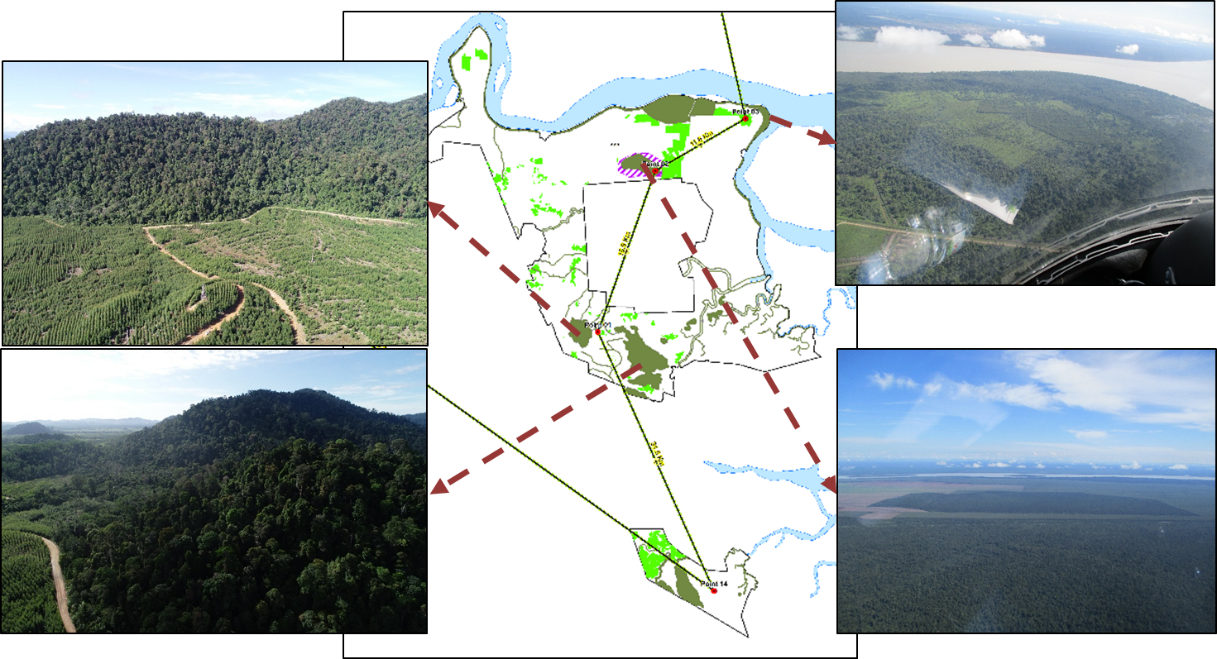
Picture 1 – Aerial Survey AHL 30 September 2020

Picture 2 Aerial Survey — APRIL Asia

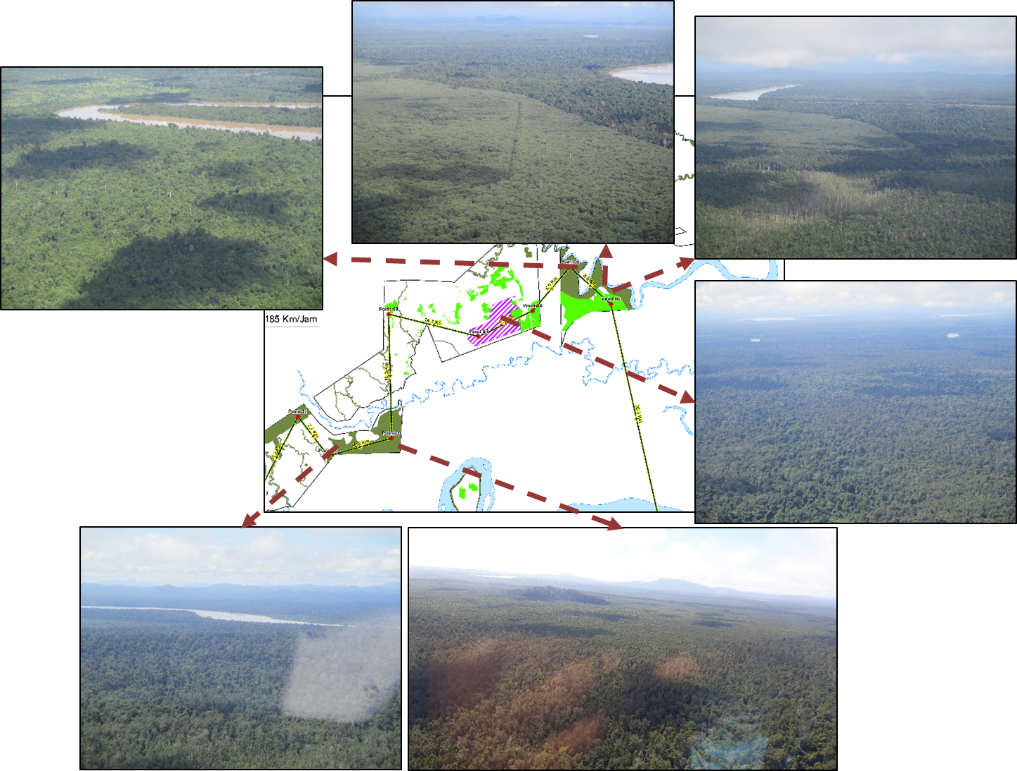
Picture 2 – Aerial Survey AHL 30 September 2020

Picture 3 Aerial Survey — APRIL Asia

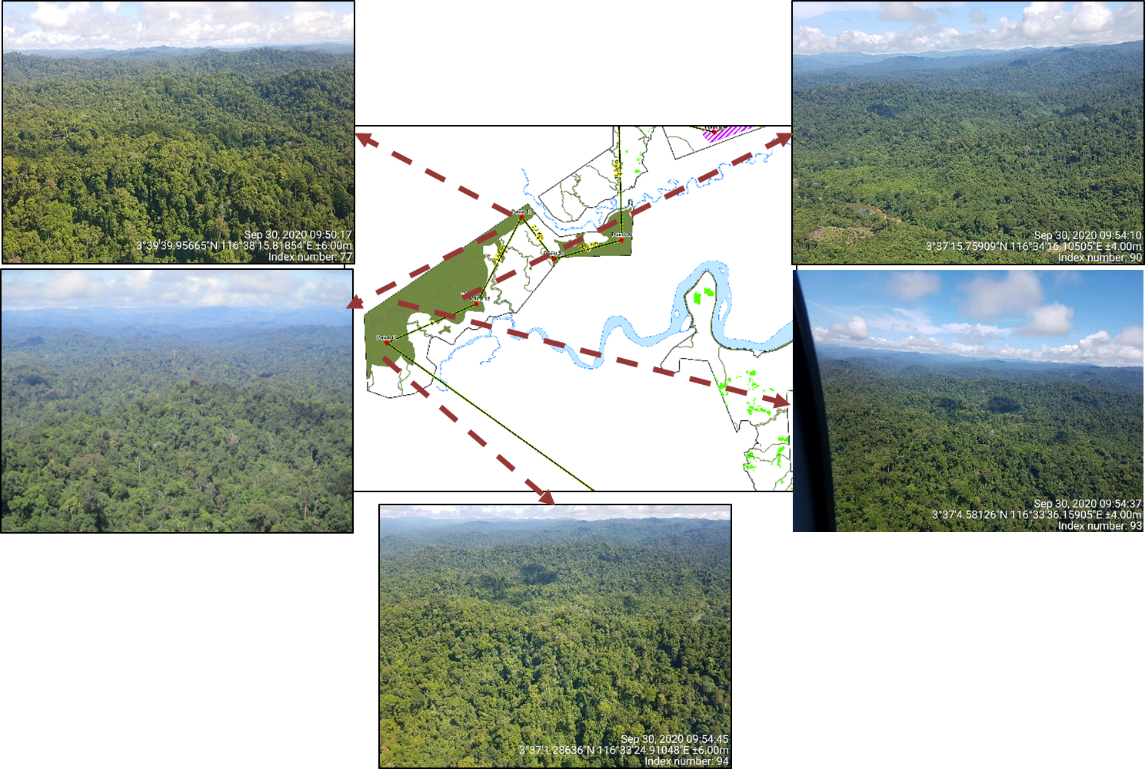
Picture 3 – Aerial Survey AHL 30 September 2020

Ownership and Organisation Structure
AHL is a key supplier to APRIL (Supplier Maps), including in the period from 2015 to 2019.

APRIL has shared a correspondence from PT. AHL with Auriga in which it clarifies its ownership and categorically states that no shareholding in PT AHL has ever been held by the shareholders of APRIL or RGE. It has further rejected other claims of business ownership or management links between PT AHL and APRIL or RGE.

KPMG Assurance

Auriga also posed questions relating to KPMG’s assurance as it applies to open market suppliers and to PT. AHL in particular. These are the facts:

  • KPMG undertakes an annual audit under the guidance of the Stakeholder Advisory Committee of APRIL’s implementation of our SFMP commitments. The audit is completed against agreed indicators developed with a range of stakeholders.
  • KPMG visited PT. AHL as part of its assurance process between APRIL 9 and 12 2018, preceded by a comprehensive desktop review.
  • KPMG’s report notes that “For Open Market Suppliers, no new development has been identified to date but not all information has yet been received from the suppliers.” This resulted in an Opportunity for Improvement (OFI#1).
  • OFI#1 relates to APRIL’s Land Cover Change (LCC) monitoring procedure which is used to identify new development. KPMG noted that there were still 511 hectares of LCC from Open Market suppliers that had not been verified and that the majority (82%) related to one supplier (not PT. AHL).
  • OFI#1 has since been closed with improvements to the procedure and better reporting from our suppliers.
  • This assurance report is publicly available (2017 Report) with all the annual reports also available (All Reports).

In closing, we have invited Auriga to visit PT AHL’s operations and ground-truth the data we have provided and requested that our full response be included in its final report to stakeholders. We will also take the opportunity to update this response should further allegations be noted when Auriga’s report is published.

svg+xml;charset=utf — APRIL Asia
sustainable growth — APRIL Asia

Method

Waste disposed is recorded through various means of measurement including estimation of weight by waste type. Particular waste types as described above are measured as a wet waste and converted to a bone dry (BD) weight. The wet waste weight is multiplied by the consistency of each waste type to determine the BD. The consistency is predetermined by the lab.

Baseline
71kg/T

Performance 2022

On Track

sustainable growth — APRIL Asia

Method

The DPTW utilisation rate and % of textile waste per tonne of product will be based on R&D lab/pilot/demo procedures.

Baseline
0%

Performance 2022

In Development

sustainable growth — APRIL Asia

Method

Water consumption per tonne of product is calculated based on water consumed in the production of saleable pulp, paper, viscose staple fiber and viscose yarn measured by flow meters, via calculation and water balances divided by the production figures for saleable pulp, paper, viscose staple fibre and viscose yarn.

Baseline
28 m3/T

Performance 2022

Not Progressing

sustainable growth — APRIL Asia

Method

Soda content within the liquor cycle and losses are determined by means of mass balance based on daily lab analysis.

Lime volume in the lime kiln and losses are determined by means of lime make-up.

The recovery rate is calculated net of the percentage of make-up amounts added. The annual figure is based on the average monthly recovery rate.

Baseline
96%

Performance 2022

Not Progressing

inclusive progress — APRIL Asia

Method

Number of Mill and Nursery contractor calculated based on Man Power data which grouped by gender level calculated as a monthly average.

Baseline
2571

inclusive progress — APRIL Asia

Method

The number of own and supply partners employees is calculated based on year-end Man Power data which is grouped by gender. The identification of leadership position refer to employees’ grade D2 or Manager level and above.

Baseline
55 women employees in leadership positions

Performance 2022

Progressing

inclusive progress — APRIL Asia

Method

Women’s effective participation is identified from the participation list for each program. Percentage of female participation is calculated by the number of women participating divided by the total participants.

Baseline
34%

Performance 2022

Progressing

inclusive progress — APRIL Asia

Method

In development

Baseline
In development

Performance 2022

Progressing

inclusive progress — APRIL Asia

Method

In development

Baseline
In development

Performance 2022

Progressing

inclusive progress — APRIL Asia

Method

In development

Baseline
In development

Performance 2022

Progressing

inclusive progress — APRIL Asia

Method

We engaged third party to conduct assessment in APRIL-supported schools using the framework that was developed by Research Triangle Institute (RTI) and USAID.

Baseline
In development

Performance 2022

Progressing

inclusive progress — APRIL Asia

Method

Poverty mapping is identified through:

  1. Desktop analysis using National Statistics, Village Potential Statistics, SMERU Poverty Map.
  2. On-the-ground verification through FGD, village transect walk, interview with community.

Baseline
3%

Performance 2022

Progressing

thriving landscapes — APRIL Asia

Method

Peer-reviewed scientific journal publication standards

Baseline
1

Performance 2022

On Track

thriving landscapes — APRIL Asia

Method

Documentation of Participation (presentation of papers or posters) in national and international dialogues, workshops and conferences

Baseline
6

Performance 2022

On Track

thriving landscapes — APRIL Asia

Method

Number of scientists from universities and research institutions that have collaborated with APRIL on peatland management during the calendar year

Baseline
9

Performance 2022

On Track

thriving landscapes — APRIL Asia

Method

Wood deliveries (excluding open market supply) to the mill are used as a basis to calculate MAI (Tonnes/ Ha/Yr). The MAI is based on the 3 year area weighted rolling average growth for all closed compartments.

Baseline
20T/ha/yr

Performance 2022

On Track

thriving landscapes — APRIL Asia

Method

Methodology to be developed specific to animal species and does not include plants. Qualifying initiatives may vary widely in nature but must have the animal protection as the primary objective.

Partnerships will be developed and documented in line with an overarching strategy prioritizing stakeholders and threats specific to the country of Indonesia assessed.

Performance 2022

Progressing

thriving landscapes — APRIL Asia

Method

May include various initiatives relating to conservation of RTE species to be defined in a priority list, initiatives may be conducted solely or in collaboration with other stakeholders.

Baseline
2

thriving landscapes — APRIL Asia

Method

Methodology to be developed to measure change in ecosystem services and values over time (carbon sequestration, water provision, resource provision including fish and honey)

Baseline
not yet developed

thriving landscapes — APRIL Asia

Method

Reports for reforestation of previously encroached and degraded area including all areas where assisted natural regeneration, planting or enrichment planting of species that improve habitat value have taken place during the year but excludes natural regeneration.

Baseline
275 ha

Performance 2022

Progressing

thriving landscapes — APRIL Asia

Method

Area within conservation is derived from land bank which is based on land cover analysis and is updated annually to capture any boundary changes, land use changes or measurement data.

Baseline
0 ha Net loss

Performance 2022

Not Progressing

thriving landscapes — APRIL Asia

Method

Landscape conservation funding includes restoration and conservation costs associated with the RER as well as the allocation of a proportion of the costs related to APRIL’s maintenance of conservation values under its production-protection model. The allocation is based on proportionate amount of each cost that is related to conservation and restoration.

The wood volume is based on wood delivered to the Mill.

Baseline
USD$0.7 per tonne of plantation fiber

Performance 2022

On Track

climate positive 1 — APRIL Asia

Method

Mill

Calculate from the records of fuel types used the amount consumed in boilers to generate power, heat and steam including energy use for mobile & including transportation. Each of the fuel types are converted to energy expressed by Giga Joule Lower Heating Value (GJ LHV) following the IPCC guidelines.

Baseline: 87%

Performance 2022

On Track

Forest Operations

Calculate from the records of fuel types the quantity consumed by major categories of forest management activities by Fiber operations.

This covers energy used for Forest operations, infrastructure including wood transport from estate to mill; When a blend of fuel types is used (such as B20) the contribution to renewable and cleaner energy targets is calculated separately for each fuel rather than considering the blend as a cleaner fuel type.

Baseline: 19%

Performance 2022

Progressing

climate positive 1 — APRIL Asia

Method

APRIL follows the international GHG protocol as developed by WRI/WBCSD to develop its emissions profile. The total emissions measured as emissions intensity is calculated based on tonnes of Scope 1 and 2 Mill Greenhouse Gas Emissions per tonne of product (paper, pulp and viscose). The emissions boundary scope covers gate-to-gate (wood processing in wood yard until pulp, paper and viscose production) of the three main GHGs: CO2, CH4, and N2O.

Baseline
0.55 tCO2e/product tonne

Performance 2022

On Track

climate positive 1 — APRIL Asia

Method

To quantify the total GHG emission and removals across APRIL’s land bank from land use, APRIL follows the GHG Protocol Agricultural Guidance and IPCC Guidelines for Agricultural, Forestry, and Other Land Use. To detect the land cover change within the look-back period, i.e. 20 years APRIL utilized the remotely sensed data.

The GHG emission will be calculated as the total of carbon stock changes in woody biomass and soil organic carbon and include all major carbon fluxes such as peat decomposition, plantation growth and harvesting, and fires.

To quantify the amount of carbon unit to balance the emission, the Verified Carbon Standard (VCS), the Climate, Community and Biodiversity Standards (CCB), or other internationally accepted standard will be used.

Performance 2022

Progressing

This site is registered on wpml.org as a development site. Switch to a production site key to remove this banner.