
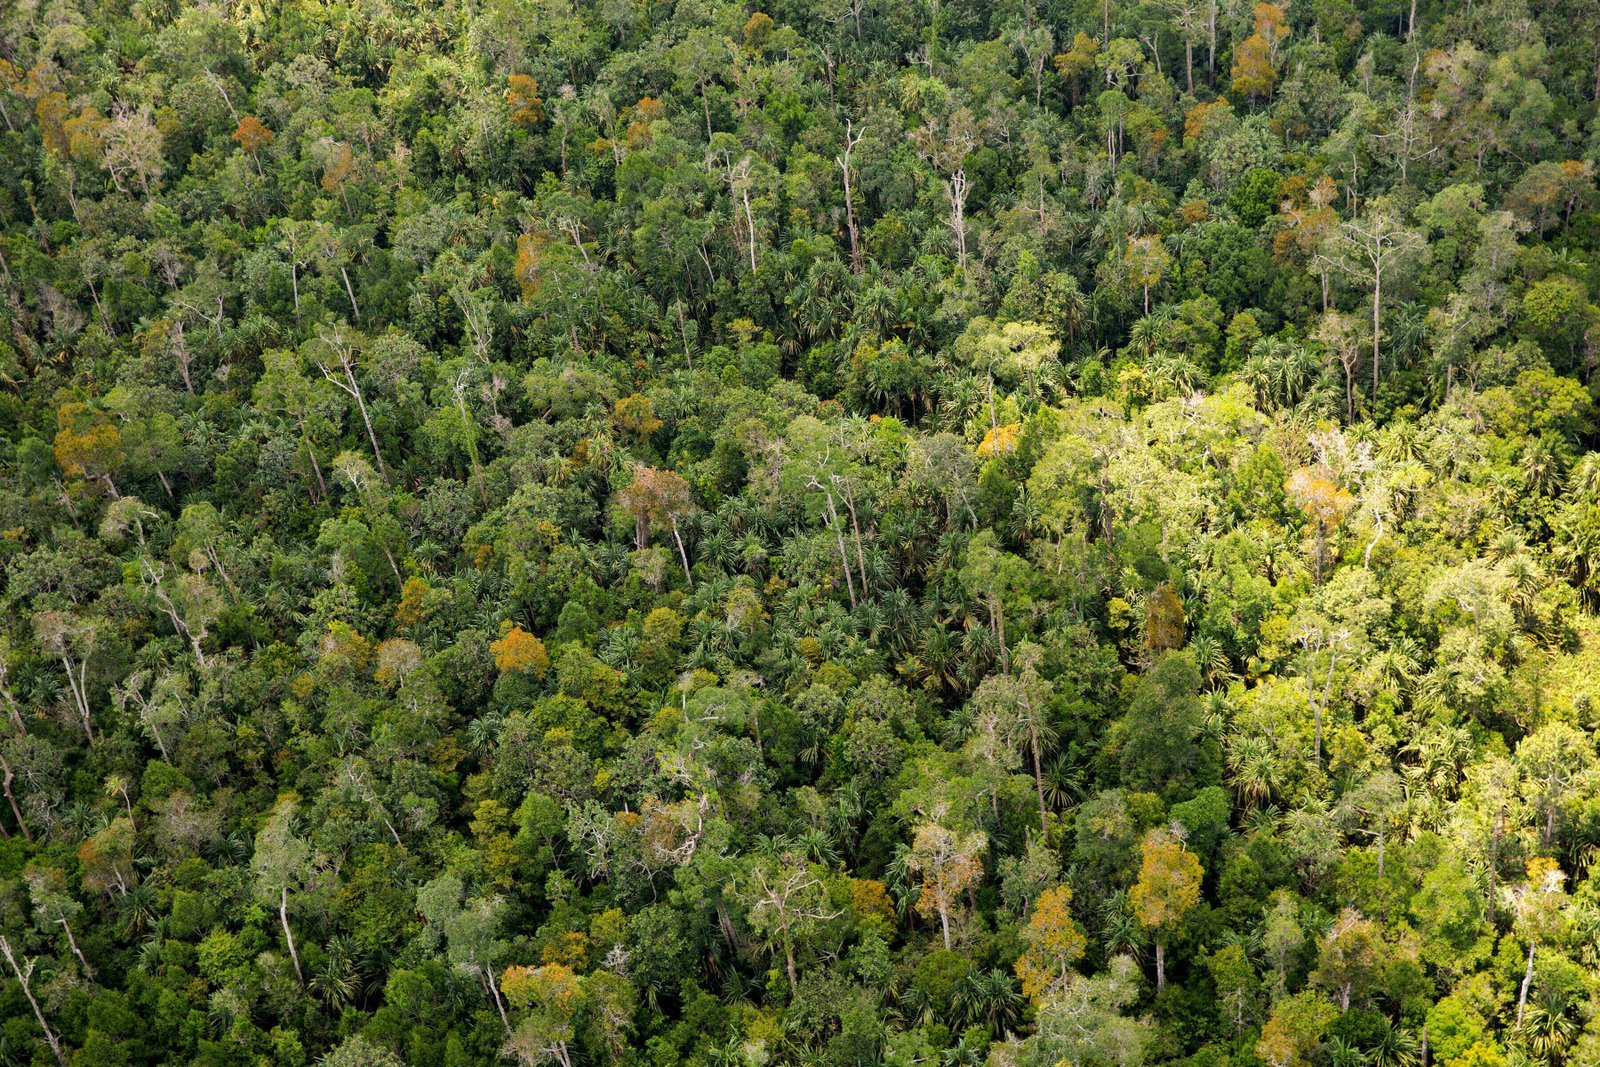
エイプリル社は、持続可能な森林管理ポリシー(SFMP2.0)の一環として、森林破壊ゼロおよび保全林や再生林の保護および積極的管理に取り組んでいます。活動の基軸となっているのは、エイプリル社の「1対1コミットメント」、すなわちプランテーション1haにつき1haを保護するという目標です。この目標は現時点で達成率81%、保全林と生態系回復エリアを合わせて約370,000 haが保護されています。こうした成果はじめSFMP2.0の下での様々なエイプリル社のコミットメントは、第三者組織であるステークホルダー諮問委員会(SAC)による監督の下に置かれています。さらに、毎年KPMG PRIによる検証が行われ、監査結果は公表されています。

エイプリル社のポリシーには、高保護価値(HCV)および高炭素貯蔵アプローチ(HCSA)の採択も含まれています。HCVとHCSAはともに、農林業分野で広く受け入れられている方法論です。グリーンピースやWWFはじめ世界的NGOも、この方法論を支持しています。HCVは、森林管理協議会などの国際的な森林管理認証基準にも組み込まれています。HCVもHCSも、総合的マルチステークホルダー・プロセスを通じて開発されたアプローチです。

キャノピー「古くから続く&絶滅危機林」の定義

カナダのNGOキャノピー(Canopy)は、独自のキャノピースタイル監査を実施しています。この監査は、繊維生産活動に利用することに高リスクないし問題がある森林を「古くから続く&絶滅危機林(AEF)」に分類し、該当する森林からの繊維生産を根絶することを狙いとしたものです。

キャノピーのAEFは非常に広義の定義です。人為的に乱されていない森林景観モザイク(HCV2)、自然のまま残された希少な森林タイプ(HCV3)、人為的活動に起因して希少となっている森林タイプ(HCV3)、生物種が豊富な森林、希少・絶滅危惧種の存在率が高い森林、地域固有性の高い森林、重要生物種の中心的生息地、または希少な生態学的および進化的様相を呈している森林――これらすべてがAEFに分類されています(HCV1、2および3)。

この定義に基づき、キャノピーは、9種の背景レイヤ(下記のリストを参照)を用いてAEFマップを作成しています。AEFの輪郭は、レイヤを重ね合わせることで定まります。ある地域がAEFに分類されている場合、それは、様々な生態学的構成要素または生態学的価値の少なくとも1つ以上が、その地域において見出されていることを意味します。レイヤの中には、全世界で森林景観の複雑な性質を定義するために必要な空間分解能よりも、はるかに分解能の低いレイヤ(100km×100kmすなわち10,000km2)も含まれています。

最初にはっきりさせておくべき重要事項として、エイプリル社は、ソースデータについては疑問を呈しておらず、AEFマッピングに「事実に関する」不正確さやエラーがあるとは考えていません。しかしながら、エイプリル社では、空間分解能が低いことで精度レベルが劣り、そのためにインドネシアにおいてはAEFの適用可能性が甚だしく低くなっていると考えます。実際、AEFマッピングでは、例えば5千万人以上の人口が居住するスマトラ島はほぼ全島的にAEFとみなされています(マップ1)。
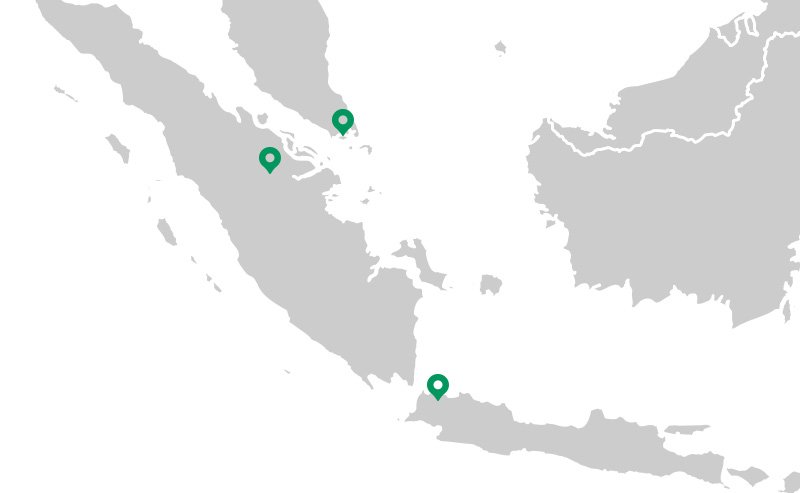
Canopy AEF

マップ1:キャノピーAEF(出典:https://canopyplanet.org/tools/forestmapper/app/)

加えて、空間分解能の低いキャノピーのマップでは、インドネシアとマレーシアの半分以上がAEFに分類されています。ヨーロッパや他のOECD諸国には、キャノピーの定義によるAEFはほぼ存在しない点にも留意する必要があります(マップ2)。
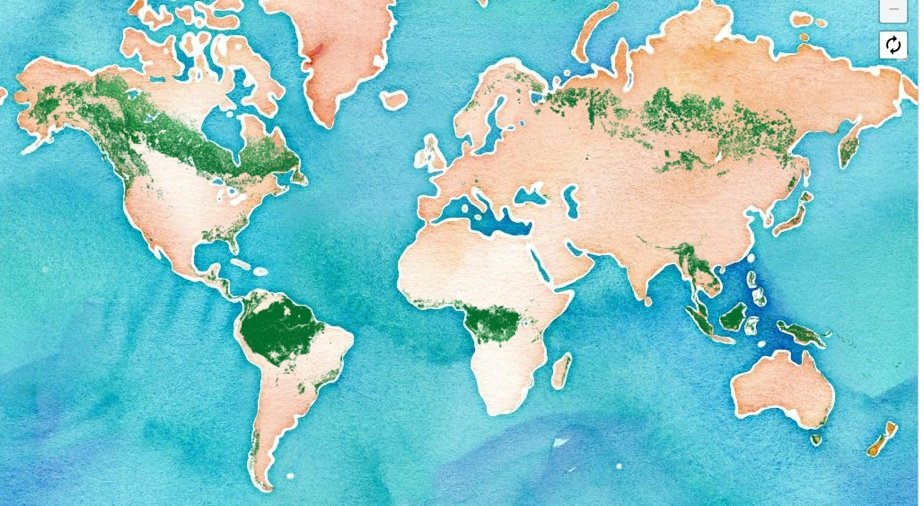
Canopy AEF Global

マップ2:全世界のキャノピーAEF分布(出典:https://canopyplanet.org/tools/forestmapper/app/)

こうしたことが何を意味するか?

キャノピーは、こうした独自解釈に基づいて、AEFに分類される地域の繊維生産源利用には高リスクが付随すると示唆します。このことは、インドネシアのスマトラ島など発展途上経済地域からの繊維生産は本質的リスクをはらむことを暗示し、一方で現地の実態や特質は無視されています。除外(exclusion)の原則を順守するキャノピーのアプローチでは、多様性のある景観の複雑さは考慮されず、多種の土地利用、コミュニティー権利、および国の社会経済ニーズの認識を踏まえて環境保護ニーズとのバランス調整の必要性が無視されてしまっています。

エイプリル社は、マップ作成をはじめ、インドネシアはもとより地球全体の持続可能な森林管理に寄与するツールの開発をサポートしています。しかし、これらのツールが有用なものとなるには、次の条件が満たされる必要があると、エイプリル社は考えます:

  • インドネシアはじめ全世界の実際の持続可能な森林管理ポリシー開発、実践活動および事業活動の基盤となっている詳細、ロバスト、ピアレビューに基づく科学的分析を組み入れる
  • 現在よりも高レベルの空間分解能ツールを使用し、精度と信頼性を高める
  • オープンで透明性が高いマルチステークホルダー協議プロセスを踏まえる
  • グローバルな森林認証や保証の枠組みおよび市民組織の多方面からの推進力と強力なサポートを得る

エイプリル社では、こうした基準が満たされて初めて、Forest MapperのようなツールやAEFという概念は有用性を持つ――すなわち、インドネシアやマレーシアはじめ、ビスコースなどの商品の持続可能な生産が展開されている地域の評価において信頼性を持ち、妥当性があり、バランスの取れたものとなると考えます。

インドネシア国内の高保護価値森林の保護は決定的重要性を持つことについて、エイプリル社では全く異論はありません。それどころかエイプリル社では、SFMPの一環として実際に高保護価値地域の保護活動に取り組んでいます。こうした保護活動は、プランテーション景観におけるエイプリル社保全林管理枠組みの基盤をなしています。また、エイプリル社のRER(リアウ生態系回復)プログラムでは、生態学的に重要性の高い泥炭地林150,000 haの保護と再生を進めています。こうしたイニシアチブは、エイプリル社が企業として自然保護の責務に真摯に取り組み、現実に「ロバストな自然保護プランニング・プロセス」を実践していることの証です。キャノピーはもとよりステークホルダーに対し、ここに改めて申し上げます。

マッピングソースデータ

  1. トラの分布(野生生物保護学会、WWF、スミソニアン協会Save the Tigerファンド、2017年)
  2. ゾウの分布(WWF、ガーディアン紙経由、2012年)
  3. 生物種多様性ホットスポット(コンサベーション・インターナショナル、2011年)
  4. 哺乳類の豊さ(Biod.Map Org、2013年)
  5. 脅威にさらされている哺乳類(Biod.Map Org、2013年)
  6. 鳥類の豊かさ(Biod.Map Org、2013年)
  7. 脅威にさらされている鳥類(Biod.Map Org、2013年)
  8. 土壌炭素密度(WRI、2017年)
  9. 森林炭素密度(各種情報源、2016年)

参考資料

「危機に瀕している森林:高優先度保全価値保護林。企業コミットメントのための指針」(森林リーダーシップフォーラム、2002年)http://canopyplanet.org/wp-content/uploads/2015/03/Wye-EF-Report.pdf
キャノピー古くから続く&絶滅危機森林: https://canopyplanet.org/solutions/ancient-forest-friendly/ancient-forest-friendly-defined/
人為的に乱されていない森林景観:http://www.intactforests.org/index.html

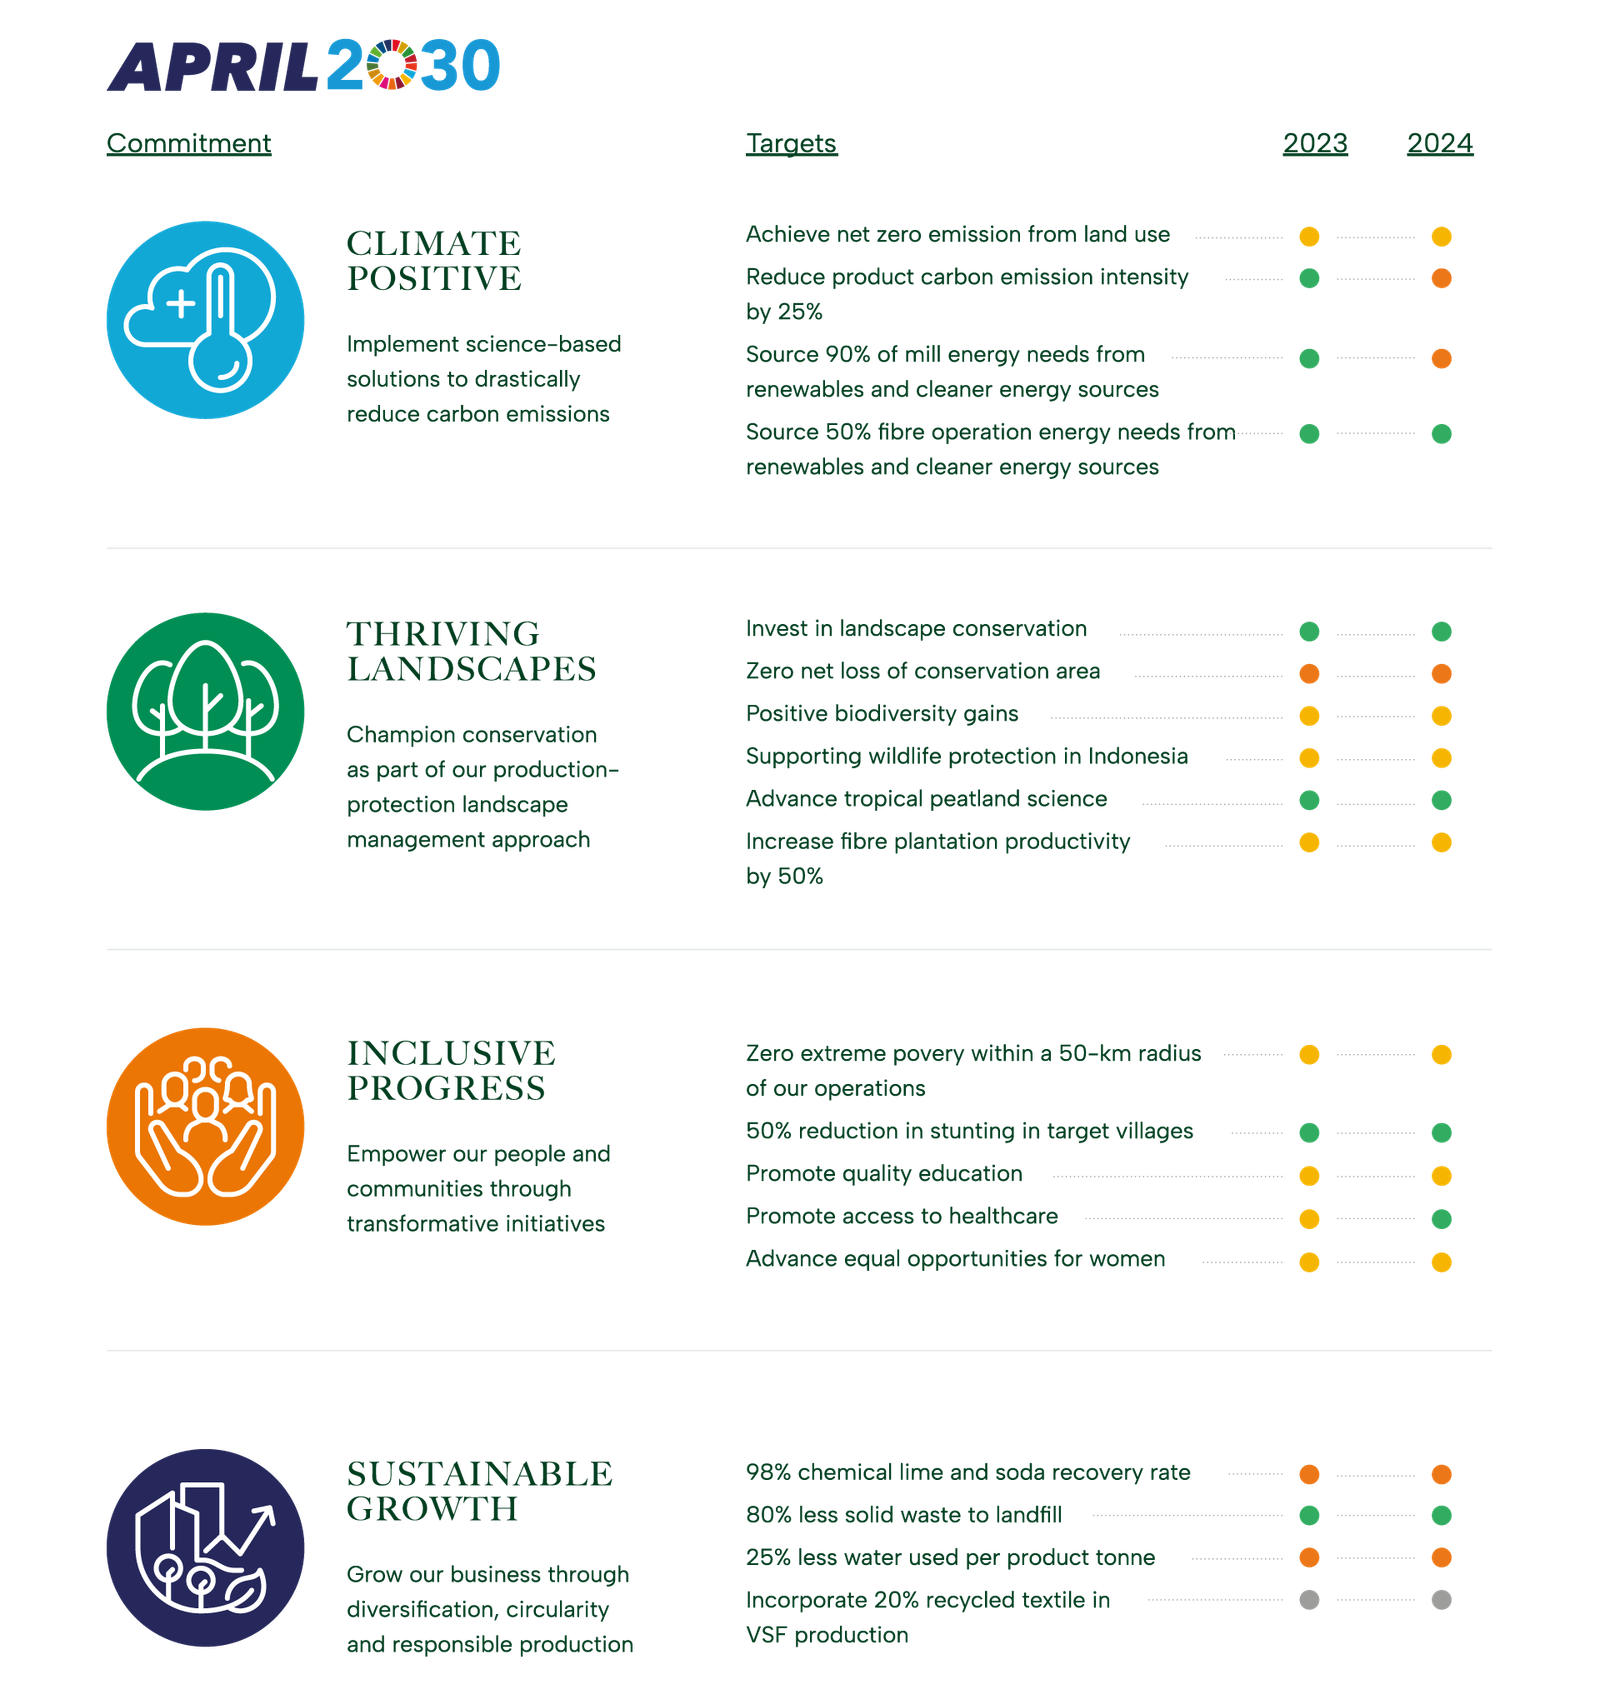
svg+xml;charset=utf — APRIL Asia
sustainable growth — APRIL Asia

Method

Waste disposed is recorded through various means of measurement including estimation of weight by waste type. Particular waste types as described above are measured as a wet waste and converted to a bone dry (BD) weight. The wet waste weight is multiplied by the consistency of each waste type to determine the BD. The consistency is predetermined by the lab.

Baseline
71kg/T

Performance 2022

On Track

sustainable growth — APRIL Asia

Method

The DPTW utilisation rate and % of textile waste per tonne of product will be based on R&D lab/pilot/demo procedures.

Baseline
0%

Performance 2022

In Development

sustainable growth — APRIL Asia

Method

Water consumption per tonne of product is calculated based on water consumed in the production of saleable pulp, paper, viscose staple fiber and viscose yarn measured by flow meters, via calculation and water balances divided by the production figures for saleable pulp, paper, viscose staple fibre and viscose yarn.

Baseline
28 m3/T

Performance 2022

Not Progressing

sustainable growth — APRIL Asia

Method

Soda content within the liquor cycle and losses are determined by means of mass balance based on daily lab analysis.

Lime volume in the lime kiln and losses are determined by means of lime make-up.

The recovery rate is calculated net of the percentage of make-up amounts added. The annual figure is based on the average monthly recovery rate.

Baseline
96%

Performance 2022

Not Progressing

inclusive progress — APRIL Asia

Method

Number of Mill and Nursery contractor calculated based on Man Power data which grouped by gender level calculated as a monthly average.

Baseline
2571

inclusive progress — APRIL Asia

Method

The number of own and supply partners employees is calculated based on year-end Man Power data which is grouped by gender. The identification of leadership position refer to employees’ grade D2 or Manager level and above.

Baseline
55 women employees in leadership positions

Performance 2022

Progressing

inclusive progress — APRIL Asia

Method

Women’s effective participation is identified from the participation list for each program. Percentage of female participation is calculated by the number of women participating divided by the total participants.

Baseline
34%

Performance 2022

Progressing

inclusive progress — APRIL Asia

Method

In development

Baseline
In development

Performance 2022

Progressing

inclusive progress — APRIL Asia

Method

In development

Baseline
In development

Performance 2022

Progressing

inclusive progress — APRIL Asia

Method

In development

Baseline
In development

Performance 2022

Progressing

inclusive progress — APRIL Asia

Method

We engaged third party to conduct assessment in APRIL-supported schools using the framework that was developed by Research Triangle Institute (RTI) and USAID.

Baseline
In development

Performance 2022

Progressing

inclusive progress — APRIL Asia

Method

Poverty mapping is identified through:

  1. Desktop analysis using National Statistics, Village Potential Statistics, SMERU Poverty Map.
  2. On-the-ground verification through FGD, village transect walk, interview with community.

Baseline
3%

Performance 2022

Progressing

thriving landscapes — APRIL Asia

Method

Peer-reviewed scientific journal publication standards

Baseline
1

Performance 2022

On Track

thriving landscapes — APRIL Asia

Method

Documentation of Participation (presentation of papers or posters) in national and international dialogues, workshops and conferences

Baseline
6

Performance 2022

On Track

thriving landscapes — APRIL Asia

Method

Number of scientists from universities and research institutions that have collaborated with APRIL on peatland management during the calendar year

Baseline
9

Performance 2022

On Track

thriving landscapes — APRIL Asia

Method

Wood deliveries (excluding open market supply) to the mill are used as a basis to calculate MAI (Tonnes/ Ha/Yr). The MAI is based on the 3 year area weighted rolling average growth for all closed compartments.

Baseline
20T/ha/yr

Performance 2022

On Track

thriving landscapes — APRIL Asia

Method

Methodology to be developed specific to animal species and does not include plants. Qualifying initiatives may vary widely in nature but must have the animal protection as the primary objective.

Partnerships will be developed and documented in line with an overarching strategy prioritizing stakeholders and threats specific to the country of Indonesia assessed.

Performance 2022

Progressing

thriving landscapes — APRIL Asia

Method

May include various initiatives relating to conservation of RTE species to be defined in a priority list, initiatives may be conducted solely or in collaboration with other stakeholders.

Baseline
2

thriving landscapes — APRIL Asia

Method

Methodology to be developed to measure change in ecosystem services and values over time (carbon sequestration, water provision, resource provision including fish and honey)

Baseline
not yet developed

thriving landscapes — APRIL Asia

Method

Reports for reforestation of previously encroached and degraded area including all areas where assisted natural regeneration, planting or enrichment planting of species that improve habitat value have taken place during the year but excludes natural regeneration.

Baseline
275 ha

Performance 2022

Progressing

thriving landscapes — APRIL Asia

Method

Area within conservation is derived from land bank which is based on land cover analysis and is updated annually to capture any boundary changes, land use changes or measurement data.

Baseline
0 ha Net loss

Performance 2022

Not Progressing

thriving landscapes — APRIL Asia

Method

Landscape conservation funding includes restoration and conservation costs associated with the RER as well as the allocation of a proportion of the costs related to APRIL’s maintenance of conservation values under its production-protection model. The allocation is based on proportionate amount of each cost that is related to conservation and restoration.

The wood volume is based on wood delivered to the Mill.

Baseline
USD$0.7 per tonne of plantation fiber

Performance 2022

On Track

climate positive 1 — APRIL Asia

Method

Mill

Calculate from the records of fuel types used the amount consumed in boilers to generate power, heat and steam including energy use for mobile & including transportation. Each of the fuel types are converted to energy expressed by Giga Joule Lower Heating Value (GJ LHV) following the IPCC guidelines.

Baseline: 87%

Performance 2022

On Track

Forest Operations

Calculate from the records of fuel types the quantity consumed by major categories of forest management activities by Fiber operations.

This covers energy used for Forest operations, infrastructure including wood transport from estate to mill; When a blend of fuel types is used (such as B20) the contribution to renewable and cleaner energy targets is calculated separately for each fuel rather than considering the blend as a cleaner fuel type.

Baseline: 19%

Performance 2022

Progressing

climate positive 1 — APRIL Asia

Method

APRIL follows the international GHG protocol as developed by WRI/WBCSD to develop its emissions profile. The total emissions measured as emissions intensity is calculated based on tonnes of Scope 1 and 2 Mill Greenhouse Gas Emissions per tonne of product (paper, pulp and viscose). The emissions boundary scope covers gate-to-gate (wood processing in wood yard until pulp, paper and viscose production) of the three main GHGs: CO2, CH4, and N2O.

Baseline
0.55 tCO2e/product tonne

Performance 2022

On Track

climate positive 1 — APRIL Asia

Method

To quantify the total GHG emission and removals across APRIL’s land bank from land use, APRIL follows the GHG Protocol Agricultural Guidance and IPCC Guidelines for Agricultural, Forestry, and Other Land Use. To detect the land cover change within the look-back period, i.e. 20 years APRIL utilized the remotely sensed data.

The GHG emission will be calculated as the total of carbon stock changes in woody biomass and soil organic carbon and include all major carbon fluxes such as peat decomposition, plantation growth and harvesting, and fires.

To quantify the amount of carbon unit to balance the emission, the Verified Carbon Standard (VCS), the Climate, Community and Biodiversity Standards (CCB), or other internationally accepted standard will be used.

Performance 2022

Progressing

This site is registered on wpml.org as a development site. Switch to a production site key to remove this banner.