UNGC — APRIL Asia
Article source: Inside RGE

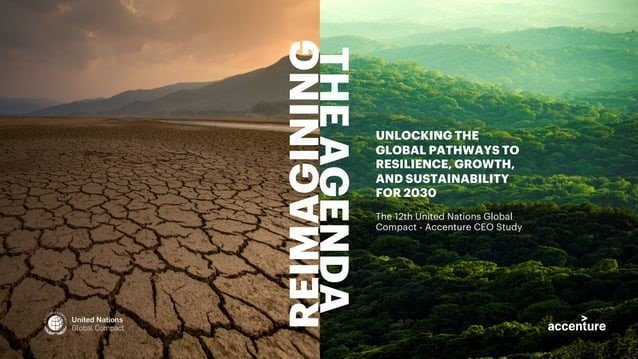
国連グローバル・コンパクトとアクセンチュアのCEOによるサステナビリティに関する調査(第12回)でAPRILグループが大きく取り上げられました。この調査では、APRILグループの前社長であるプラヴィーン・シンハヴィが、サステナビリティの目標とコミットメントを達成するためのグループ全体の取り組みを紹介し、企業が気候問題に積極的に取り組む必要がある理由について見解を述べ、成功事例を紹介しました。

「気候変動問題を地政学的理由で停滞させないことが肝要です。企業として、気候変動は我々全員が取り組むべき課題として、常に前面に押し出していく必要があります」とシンハヴィは述べています。

この65ページの調査報告書は、18の業界と128の国にまたがる2,600人以上のCEOから得た知見に基づいており、130の詳細なインタビューが含まれています。本調査では、サステナビリティの状況や、世界中の企業がサステナビリティや気候変動に関する目標を達成するためにどのような取り組みを行っているのかについて、幅広い視点から検証しています。APRILグループは、ケーススタディとして取り上げられた11社の多国籍企業のうちの1社です。

本調査では、サステナビリティへの取り組みが、事業競争力、卓越性、効率性を高めると同時に、潜在的な事業成長の道を提供し、イノベーションを促進し、一流の人材を惹きつけることができると、CEOがますます認識するようになっていることを確認しました。シンハヴィは次のように指摘します。「サステナビリティの目標を達成することは、コストを改善し、ビジネスを成長させ、気候や自然への恩恵とともに、雇用と成長の機会を提供します。」

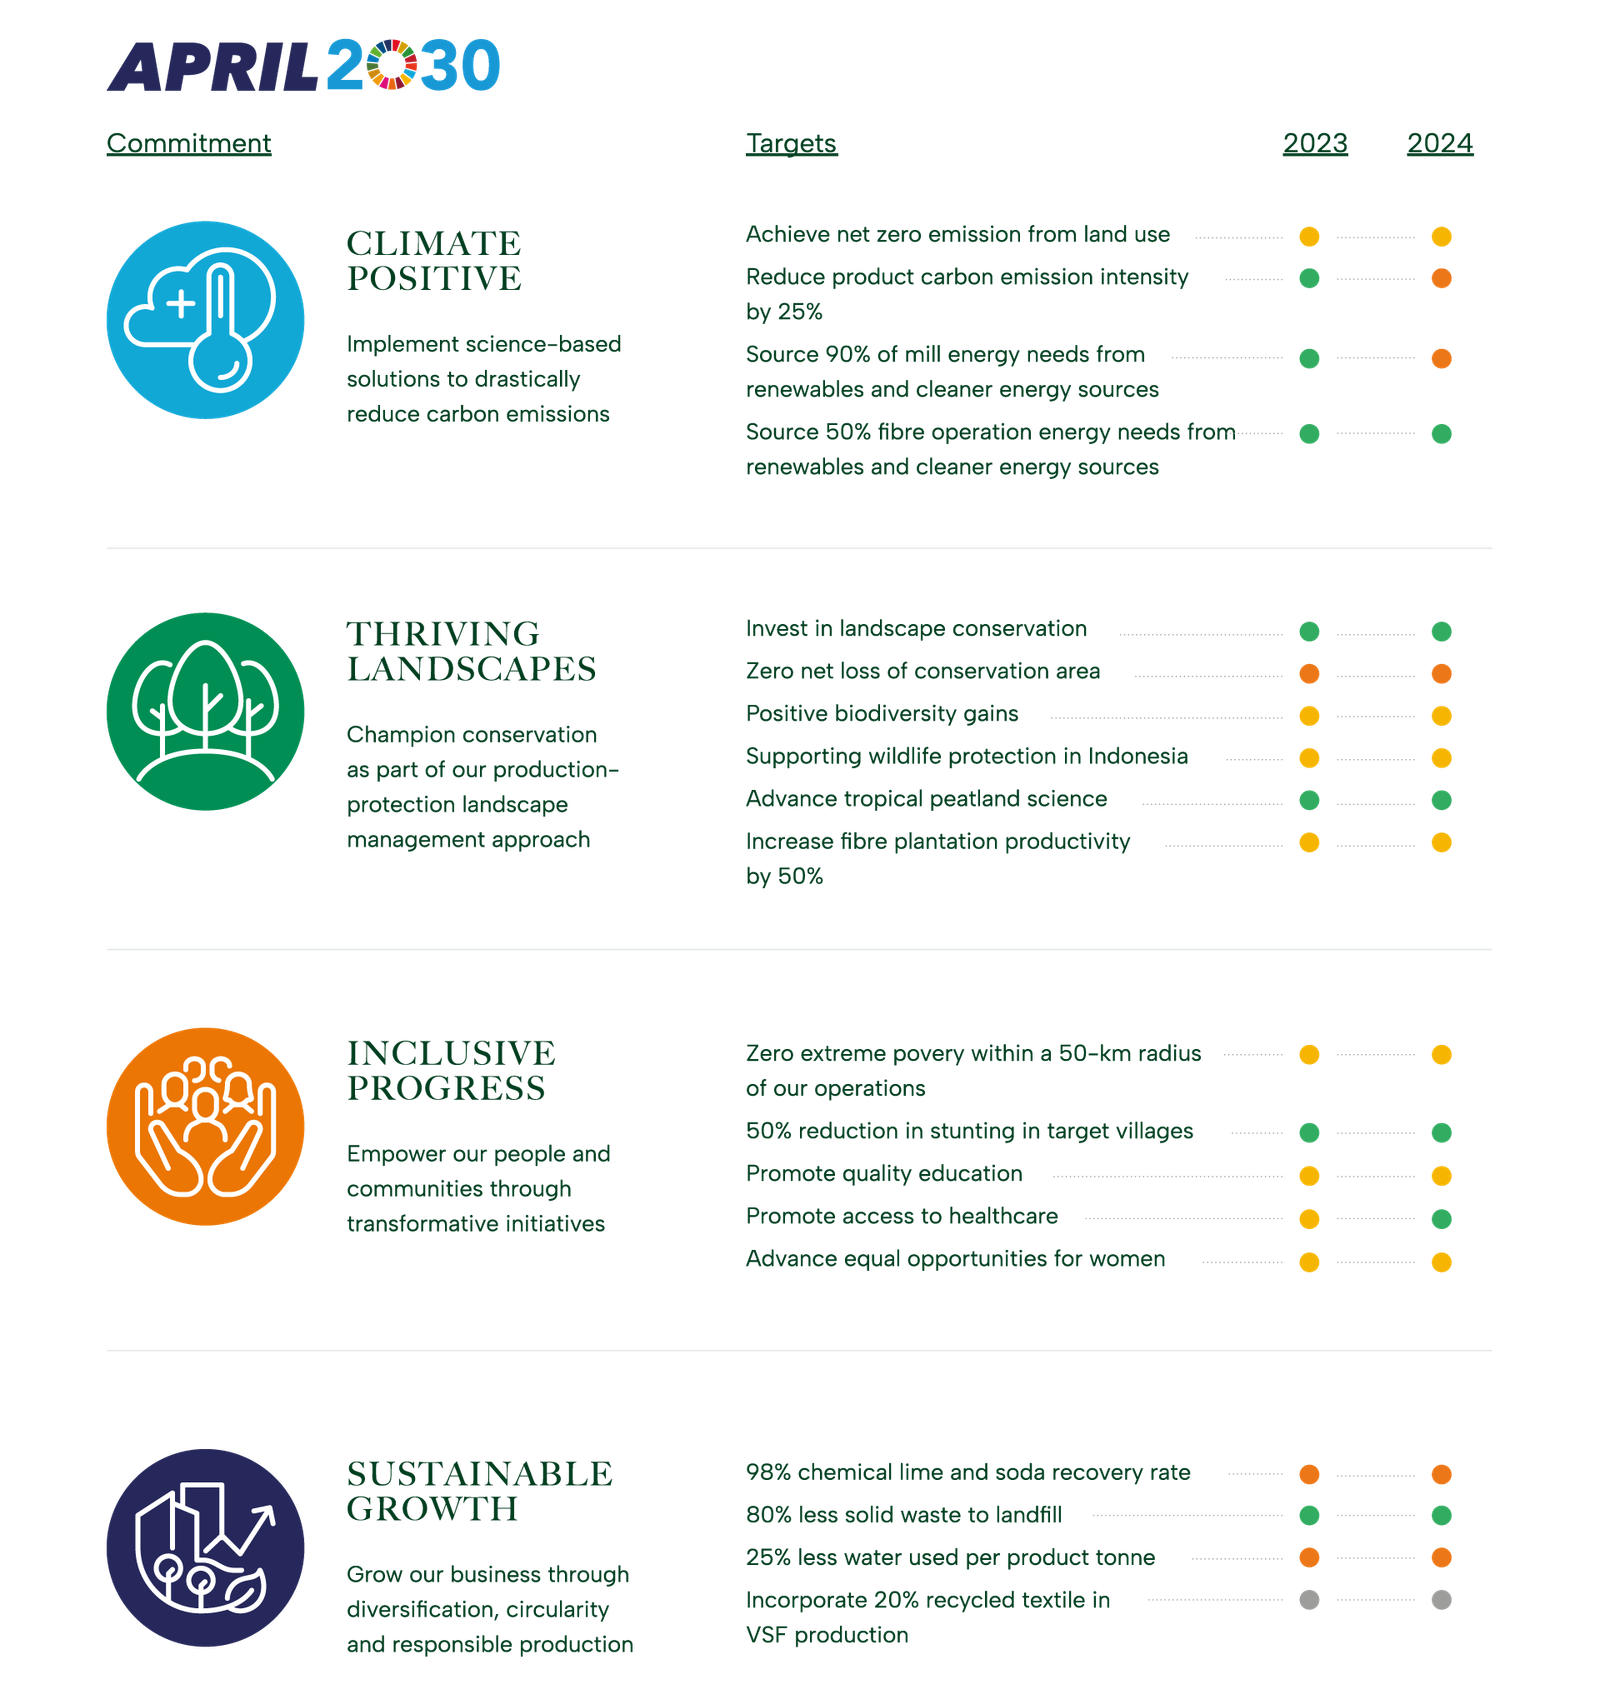
APRILグループの総合的なケーススタディでは、同グループのワークフォース・サステナビリティ教育への取り組みと、APRIL 2030の目標をどのように達成しているかが紹介されました。APRIL 2030は、今後10年間の課題に対応するための同社のビジョンで、「Climate Positive」「Thriving Landscape」「Inclusive Progress」「Sustainable Growth」という4つのコミットメントからなり、合わせて18の先進的な目標を掲げています。

infographic 1 1 — APRIL Asia

APRILグループは、これらの目標を提示する前に、経営陣と一連のワークショップを行い、賛同を得るとともに、価値観に基づく企業文化への強い連携を作り、従業員の役職に関わらずサステナビリティへのコミットメントに参加させました。このプロセスは、持続可能な目標がいかに業績を維持し、さらに向上させるかについてチームを教育し、APRIL 2030が国連の持続可能な開発目標(SGDs)に貢献していることを認識させるのに役立ちました。

APRILグループは、2030年までに気候、自然、そして人々にポジティブな影響を与えることを目的とし、組織全体のマネージャーとそのチームが参加し、18ヶ月にわたってワークショップを実施しました。これには、各公約と関連する目標を担当する代表者を特定することも含まれます。

APRILグループは、透明性と情報開示へのコミットメントの一環として、目標に対するパフォーマンスを追跡し、実証し続け、意識主導のコミュニケーションを支えとしています。

サステナビリティの目標を掲げて以来、APRILグループはすでに大きな影響を及ぼしています。APRIL 2030では、インドネシアのあらゆるセクターの企業の中で、土地使用による排出をネットゼロにすることを約束した先駆的な企業のひとつとなりました。また、気候、自然、人々にポジティブな影響を与えるために、危機感と野心を持って取り組む先進的な企業のグローバルコミュニティに加わりました。APRILグループの取り組みは、グローバル・コンパクト・ネットワーク・シンガポールから、2022年にシンガポール・アペックス・コーポレート・サステナビリティ・アワードを授与されるなど、継続的に評価されています。

APRILグループの2030年持続可能性コミットメントについては、https://april2030.aprilasia.com/でご確認ください。

国連グローバル・コンパクトとアクセンチュアの研究結果の全文(英文)はこちら。APRILグループのケーススタディは35ページに掲載されています。

svg+xml;charset=utf — APRIL Asia
sustainable growth — APRIL Asia

Method

Waste disposed is recorded through various means of measurement including estimation of weight by waste type. Particular waste types as described above are measured as a wet waste and converted to a bone dry (BD) weight. The wet waste weight is multiplied by the consistency of each waste type to determine the BD. The consistency is predetermined by the lab.

Baseline
71kg/T

Performance 2022

On Track

sustainable growth — APRIL Asia

Method

The DPTW utilisation rate and % of textile waste per tonne of product will be based on R&D lab/pilot/demo procedures.

Baseline
0%

Performance 2022

In Development

sustainable growth — APRIL Asia

Method

Water consumption per tonne of product is calculated based on water consumed in the production of saleable pulp, paper, viscose staple fiber and viscose yarn measured by flow meters, via calculation and water balances divided by the production figures for saleable pulp, paper, viscose staple fibre and viscose yarn.

Baseline
28 m3/T

Performance 2022

Not Progressing

sustainable growth — APRIL Asia

Method

Soda content within the liquor cycle and losses are determined by means of mass balance based on daily lab analysis.

Lime volume in the lime kiln and losses are determined by means of lime make-up.

The recovery rate is calculated net of the percentage of make-up amounts added. The annual figure is based on the average monthly recovery rate.

Baseline
96%

Performance 2022

Not Progressing

inclusive progress — APRIL Asia

Method

Number of Mill and Nursery contractor calculated based on Man Power data which grouped by gender level calculated as a monthly average.

Baseline
2571

inclusive progress — APRIL Asia

Method

The number of own and supply partners employees is calculated based on year-end Man Power data which is grouped by gender. The identification of leadership position refer to employees’ grade D2 or Manager level and above.

Baseline
55 women employees in leadership positions

Performance 2022

Progressing

inclusive progress — APRIL Asia

Method

Women’s effective participation is identified from the participation list for each program. Percentage of female participation is calculated by the number of women participating divided by the total participants.

Baseline
34%

Performance 2022

Progressing

inclusive progress — APRIL Asia

Method

In development

Baseline
In development

Performance 2022

Progressing

inclusive progress — APRIL Asia

Method

In development

Baseline
In development

Performance 2022

Progressing

inclusive progress — APRIL Asia

Method

In development

Baseline
In development

Performance 2022

Progressing

inclusive progress — APRIL Asia

Method

We engaged third party to conduct assessment in APRIL-supported schools using the framework that was developed by Research Triangle Institute (RTI) and USAID.

Baseline
In development

Performance 2022

Progressing

inclusive progress — APRIL Asia

Method

Poverty mapping is identified through:

  1. Desktop analysis using National Statistics, Village Potential Statistics, SMERU Poverty Map.
  2. On-the-ground verification through FGD, village transect walk, interview with community.

Baseline
3%

Performance 2022

Progressing

thriving landscapes — APRIL Asia

Method

Peer-reviewed scientific journal publication standards

Baseline
1

Performance 2022

On Track

thriving landscapes — APRIL Asia

Method

Documentation of Participation (presentation of papers or posters) in national and international dialogues, workshops and conferences

Baseline
6

Performance 2022

On Track

thriving landscapes — APRIL Asia

Method

Number of scientists from universities and research institutions that have collaborated with APRIL on peatland management during the calendar year

Baseline
9

Performance 2022

On Track

thriving landscapes — APRIL Asia

Method

Wood deliveries (excluding open market supply) to the mill are used as a basis to calculate MAI (Tonnes/ Ha/Yr). The MAI is based on the 3 year area weighted rolling average growth for all closed compartments.

Baseline
20T/ha/yr

Performance 2022

On Track

thriving landscapes — APRIL Asia

Method

Methodology to be developed specific to animal species and does not include plants. Qualifying initiatives may vary widely in nature but must have the animal protection as the primary objective.

Partnerships will be developed and documented in line with an overarching strategy prioritizing stakeholders and threats specific to the country of Indonesia assessed.

Performance 2022

Progressing

thriving landscapes — APRIL Asia

Method

May include various initiatives relating to conservation of RTE species to be defined in a priority list, initiatives may be conducted solely or in collaboration with other stakeholders.

Baseline
2

thriving landscapes — APRIL Asia

Method

Methodology to be developed to measure change in ecosystem services and values over time (carbon sequestration, water provision, resource provision including fish and honey)

Baseline
not yet developed

thriving landscapes — APRIL Asia

Method

Reports for reforestation of previously encroached and degraded area including all areas where assisted natural regeneration, planting or enrichment planting of species that improve habitat value have taken place during the year but excludes natural regeneration.

Baseline
275 ha

Performance 2022

Progressing

thriving landscapes — APRIL Asia

Method

Area within conservation is derived from land bank which is based on land cover analysis and is updated annually to capture any boundary changes, land use changes or measurement data.

Baseline
0 ha Net loss

Performance 2022

Not Progressing

thriving landscapes — APRIL Asia

Method

Landscape conservation funding includes restoration and conservation costs associated with the RER as well as the allocation of a proportion of the costs related to APRIL’s maintenance of conservation values under its production-protection model. The allocation is based on proportionate amount of each cost that is related to conservation and restoration.

The wood volume is based on wood delivered to the Mill.

Baseline
USD$0.7 per tonne of plantation fiber

Performance 2022

On Track

climate positive 1 — APRIL Asia

Method

Mill

Calculate from the records of fuel types used the amount consumed in boilers to generate power, heat and steam including energy use for mobile & including transportation. Each of the fuel types are converted to energy expressed by Giga Joule Lower Heating Value (GJ LHV) following the IPCC guidelines.

Baseline: 87%

Performance 2022

On Track

Forest Operations

Calculate from the records of fuel types the quantity consumed by major categories of forest management activities by Fiber operations.

This covers energy used for Forest operations, infrastructure including wood transport from estate to mill; When a blend of fuel types is used (such as B20) the contribution to renewable and cleaner energy targets is calculated separately for each fuel rather than considering the blend as a cleaner fuel type.

Baseline: 19%

Performance 2022

Progressing

climate positive 1 — APRIL Asia

Method

APRIL follows the international GHG protocol as developed by WRI/WBCSD to develop its emissions profile. The total emissions measured as emissions intensity is calculated based on tonnes of Scope 1 and 2 Mill Greenhouse Gas Emissions per tonne of product (paper, pulp and viscose). The emissions boundary scope covers gate-to-gate (wood processing in wood yard until pulp, paper and viscose production) of the three main GHGs: CO2, CH4, and N2O.

Baseline
0.55 tCO2e/product tonne

Performance 2022

On Track

climate positive 1 — APRIL Asia

Method

To quantify the total GHG emission and removals across APRIL’s land bank from land use, APRIL follows the GHG Protocol Agricultural Guidance and IPCC Guidelines for Agricultural, Forestry, and Other Land Use. To detect the land cover change within the look-back period, i.e. 20 years APRIL utilized the remotely sensed data.

The GHG emission will be calculated as the total of carbon stock changes in woody biomass and soil organic carbon and include all major carbon fluxes such as peat decomposition, plantation growth and harvesting, and fires.

To quantify the amount of carbon unit to balance the emission, the Verified Carbon Standard (VCS), the Climate, Community and Biodiversity Standards (CCB), or other internationally accepted standard will be used.

Performance 2022

Progressing

This site is registered on wpml.org as a development site. Switch to a production site key to remove this banner.