Cari

Written by Dr Chandra S. Deshmukh, Greenhouse Gas Specialist, APRIL Peatland Science

Tropical peatlands are a critical ecosystem in regulating global carbon cycle and climate. While existing studies have shown that land use changes impact greenhouse gas (GHG) fluxes, the magnitudes of these effects remain uncertain, especially in tropical peatlands, owing to a dearth of high-quality measurements.

Given the role of tropical peatlands as nature-based mitigators of climate change, having reliable estimates of contemporary emissions and their relationship with controlling factors, can improve our understanding of their global climate impact, and support responsible peatland management and optimization of emissions mitigation measures.

Working alongside a team of respected global scientists, we recently completed a landmark study, published on 5th APRIL 2023 in Nature, the world’s leading multidisciplinary science journal. The study has been undertaken over five years to better understand the estimates of net GHG fluxes associated with different uses of tropical peatland in Indonesia – including intact forest and Acacia fibre plantation.

Between October 2016 and May 2022, we measured GHG exchanges in intact forest, degraded forest, and Acacia crassicarpa tree plantations in the same peat landscape of Sumatra, Indonesia. We used the eddy-covariance technique to measure the net exchanges of carbon dioxide (CO2) and methane between the ecosystem and atmosphere, and tracked nitrous oxide flux in and out of the soil. Assuming that all harvested wood carbon will be returned to the atmosphere as CO2, the plantation’s CO2 emissions is calculated as the sum of net ecosystem CO2 exchange and harvested wood carbon export.

To our knowledge, this study is the first investigation of GHGs in any peatland-based fibre plantation globally to cover a full plantation-rotation period and encompassing all major GHG flux terms, including carbon loss due to plantation establishment, and the export of carbon in harvested wood and as dissolved carbon in rivers. The study then compared the results from the plantation with other long-term measurements from the degraded forest and intact forest sites to quantify the impact of land-use change on GHG fluxes. It also established associations between groundwater level and GHG fluxes.

The CO2 emissions from the plantation (fourth rotation, 17–22 years after drainage) were higher than those from intact forest, but lower than the current Intergovernmental Panel on Climate Change (IPCC) emission factor for plantations. The comparison between intact forest and Acacia plantation fluxes indicates that the conversion of intact forest to plantation results in a long-term net increase in GHG emissions of around 18 tCO2eq ha–1 year–1. But we observe that this is smaller than the increase associated with the degradation of intact forest (Fig. 1). As a by-product of pulp manufacturing, about 54% of the harvested wood from Acacia plantations is used to produce bioenergy. The calculated avoided emissions resulting from the use of tree biomass in place of coal burning is 7.3 tCO2-eq ha−1 year−1. This avoided emission through bioenergy production partly offsets the net increase in GHG emissions from the plantation itself.

figure effects of land use change on greenhouse gas — APRIL Asia

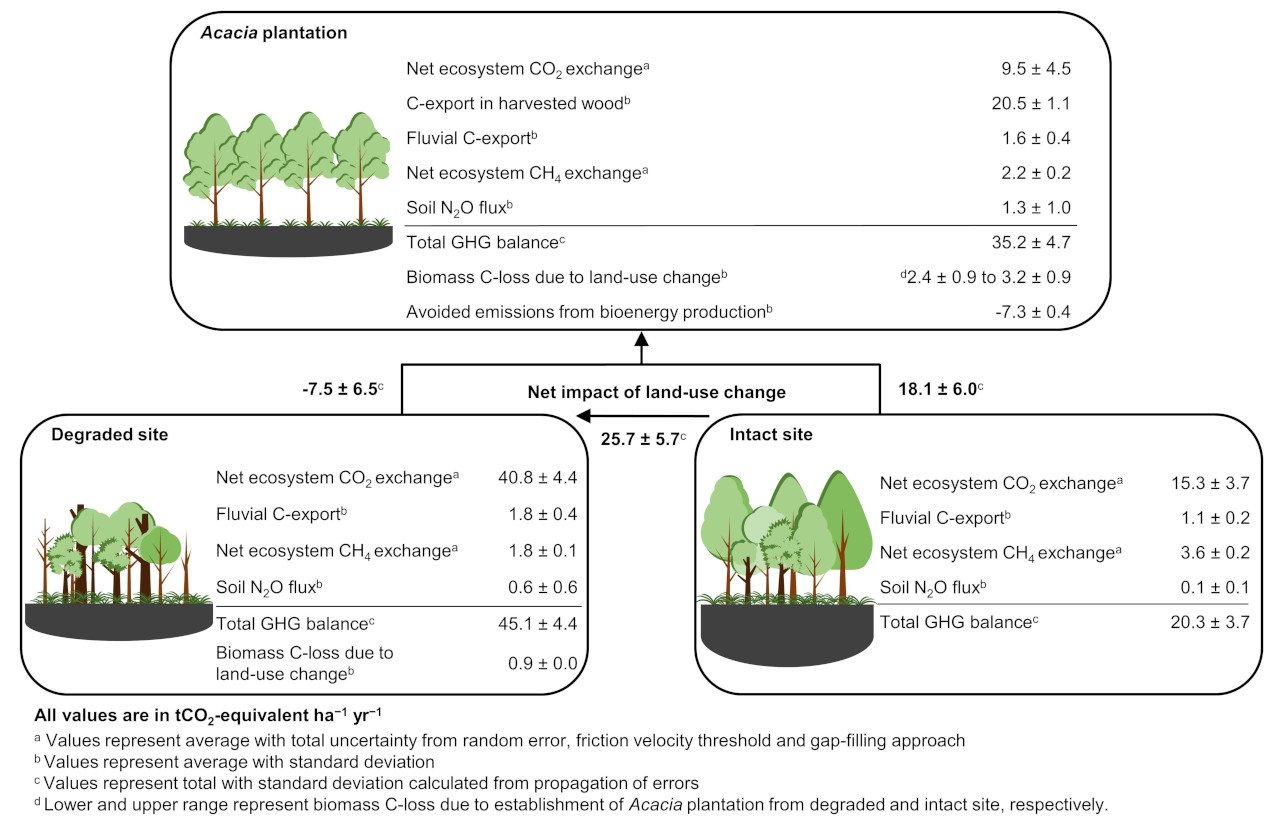
Figure 1 | Effects of land-use change on greenhouse-gas balance in tropical peatlands in Sumatra, Indonesia

Our results confirm that conserving, restoring and responsibly managing peatlands will be important for meeting nationally determined contributions (as defined by the Paris climate agreement) to limit global warming to 1.5 °C above pre-industrial levels. The strong linear relationship between CO2 flux and groundwater level (CO2 flux (tCO2 ha-1 yr-1) = –64.65 × groundwater level (m) – 10.33, R2 = 0.83; P < 0.05) suggests that, where the groundwater level is known, peatland CO2 flux can be predicted with some degree of confidence.

Although more eddy-covariance studies from tropical peatlands are needed, our research highlights that CO2 flux measurements from such studies at different groundwater levels are substantially lower than those derived from previous soil-chamber and subsidence studies in the same ecosystems. The estimates from the latter kinds of study should be considered with caution since chamber flux measurements might be interfered with flux from root respiration, while subsidence is also influenced by soil compaction and consolidation, and hence not directly representing CO2­ flux due to peat decomposition.

More studies are needed to examine the GHG effects of smallholdings, which occupy about two-thirds of the managed peatland area in Indonesia. We believe similar studies are also needed to investigate land-use change effects occurring in other tropical peatlands, such as those of the Amazon and Congo basins; these have different rainfall regimes, vegetation and peat-formation histories but are also of global importance.

This five–year study was made possible through the dedicated efforts and commitment of a team of young Indonesian scientists whose tenacity, motivation and commitment have expanded our knowledge and continue to advance the boundaries of scientific knowledge to a better understanding of peat landscapes of Sumatra, Indonesia and their role in global climate solutions. We also acknowledge and appreciate the collaborative efforts of all stakeholders who invested their time, resources and expertise, without which this research would not have been possible.

Our results can help to reduce the uncertainty in peatland GHG emissions estimates, provide an estimate of the impact of land-use change on tropical peat, and develop science-based peatland management practices as nature-based climate solutions.

For the full research on Nature, please visit: Nature.com
For a summary of the study, please see: Nature Research Briefing

svg+xml;charset=utf — APRIL Asia
sustainable growth — APRIL Asia

Method

Waste disposed is recorded through various means of measurement including estimation of weight by waste type. Particular waste types as described above are measured as a wet waste and converted to a bone dry (BD) weight. The wet waste weight is multiplied by the consistency of each waste type to determine the BD. The consistency is predetermined by the lab.

Baseline
71kg/T

Performance 2022

On Track

sustainable growth — APRIL Asia

Method

The DPTW utilisation rate and % of textile waste per tonne of product will be based on R&D lab/pilot/demo procedures.

Baseline
0%

Performance 2022

In Development

sustainable growth — APRIL Asia

Method

Water consumption per tonne of product is calculated based on water consumed in the production of saleable pulp, paper, viscose staple fiber and viscose yarn measured by flow meters, via calculation and water balances divided by the production figures for saleable pulp, paper, viscose staple fibre and viscose yarn.

Baseline
28 m3/T

Performance 2022

Not Progressing

sustainable growth — APRIL Asia

Method

Soda content within the liquor cycle and losses are determined by means of mass balance based on daily lab analysis.

Lime volume in the lime kiln and losses are determined by means of lime make-up.

The recovery rate is calculated net of the percentage of make-up amounts added. The annual figure is based on the average monthly recovery rate.

Baseline
96%

Performance 2022

Not Progressing

inclusive progress — APRIL Asia

Method

Number of Mill and Nursery contractor calculated based on Man Power data which grouped by gender level calculated as a monthly average.

Baseline
2571

inclusive progress — APRIL Asia

Method

The number of own and supply partners employees is calculated based on year-end Man Power data which is grouped by gender. The identification of leadership position refer to employees’ grade D2 or Manager level and above.

Baseline
55 women employees in leadership positions

Performance 2022

Progressing

inclusive progress — APRIL Asia

Method

Women’s effective participation is identified from the participation list for each program. Percentage of female participation is calculated by the number of women participating divided by the total participants.

Baseline
34%

Performance 2022

Progressing

inclusive progress — APRIL Asia

Method

In development

Baseline
In development

Performance 2022

Progressing

inclusive progress — APRIL Asia

Method

In development

Baseline
In development

Performance 2022

Progressing

inclusive progress — APRIL Asia

Method

In development

Baseline
In development

Performance 2022

Progressing

inclusive progress — APRIL Asia

Method

We engaged third party to conduct assessment in APRIL-supported schools using the framework that was developed by Research Triangle Institute (RTI) and USAID.

Baseline
In development

Performance 2022

Progressing

inclusive progress — APRIL Asia

Method

Poverty mapping is identified through:

  1. Desktop analysis using National Statistics, Village Potential Statistics, SMERU Poverty Map.
  2. On-the-ground verification through FGD, village transect walk, interview with community.

Baseline
3%

Performance 2022

Progressing

thriving landscapes — APRIL Asia

Method

Peer-reviewed scientific journal publication standards

Baseline
1

Performance 2022

On Track

thriving landscapes — APRIL Asia

Method

Documentation of Participation (presentation of papers or posters) in national and international dialogues, workshops and conferences

Baseline
6

Performance 2022

On Track

thriving landscapes — APRIL Asia

Method

Number of scientists from universities and research institutions that have collaborated with APRIL on peatland management during the calendar year

Baseline
9

Performance 2022

On Track

thriving landscapes — APRIL Asia

Method

Wood deliveries (excluding open market supply) to the mill are used as a basis to calculate MAI (Tonnes/ Ha/Yr). The MAI is based on the 3 year area weighted rolling average growth for all closed compartments.

Baseline
20T/ha/yr

Performance 2022

On Track

thriving landscapes — APRIL Asia

Method

Methodology to be developed specific to animal species and does not include plants. Qualifying initiatives may vary widely in nature but must have the animal protection as the primary objective.

Partnerships will be developed and documented in line with an overarching strategy prioritizing stakeholders and threats specific to the country of Indonesia assessed.

Performance 2022

Progressing

thriving landscapes — APRIL Asia

Method

May include various initiatives relating to conservation of RTE species to be defined in a priority list, initiatives may be conducted solely or in collaboration with other stakeholders.

Baseline
2

thriving landscapes — APRIL Asia

Method

Methodology to be developed to measure change in ecosystem services and values over time (carbon sequestration, water provision, resource provision including fish and honey)

Baseline
not yet developed

thriving landscapes — APRIL Asia

Method

Reports for reforestation of previously encroached and degraded area including all areas where assisted natural regeneration, planting or enrichment planting of species that improve habitat value have taken place during the year but excludes natural regeneration.

Baseline
275 ha

Performance 2022

Progressing

thriving landscapes — APRIL Asia

Method

Area within conservation is derived from land bank which is based on land cover analysis and is updated annually to capture any boundary changes, land use changes or measurement data.

Baseline
0 ha Net loss

Performance 2022

Not Progressing

thriving landscapes — APRIL Asia

Method

Landscape conservation funding includes restoration and conservation costs associated with the RER as well as the allocation of a proportion of the costs related to APRIL’s maintenance of conservation values under its production-protection model. The allocation is based on proportionate amount of each cost that is related to conservation and restoration.

The wood volume is based on wood delivered to the Mill.

Baseline
USD$0.7 per tonne of plantation fiber

Performance 2022

On Track

climate positive 1 — APRIL Asia

Method

Mill

Calculate from the records of fuel types used the amount consumed in boilers to generate power, heat and steam including energy use for mobile & including transportation. Each of the fuel types are converted to energy expressed by Giga Joule Lower Heating Value (GJ LHV) following the IPCC guidelines.

Baseline: 87%

Performance 2022

On Track

Forest Operations

Calculate from the records of fuel types the quantity consumed by major categories of forest management activities by Fiber operations.

This covers energy used for Forest operations, infrastructure including wood transport from estate to mill; When a blend of fuel types is used (such as B20) the contribution to renewable and cleaner energy targets is calculated separately for each fuel rather than considering the blend as a cleaner fuel type.

Baseline: 19%

Performance 2022

Progressing

climate positive 1 — APRIL Asia

Method

APRIL follows the international GHG protocol as developed by WRI/WBCSD to develop its emissions profile. The total emissions measured as emissions intensity is calculated based on tonnes of Scope 1 and 2 Mill Greenhouse Gas Emissions per tonne of product (paper, pulp and viscose). The emissions boundary scope covers gate-to-gate (wood processing in wood yard until pulp, paper and viscose production) of the three main GHGs: CO2, CH4, and N2O.

Baseline
0.55 tCO2e/product tonne

Performance 2022

On Track

climate positive 1 — APRIL Asia

Method

To quantify the total GHG emission and removals across APRIL’s land bank from land use, APRIL follows the GHG Protocol Agricultural Guidance and IPCC Guidelines for Agricultural, Forestry, and Other Land Use. To detect the land cover change within the look-back period, i.e. 20 years APRIL utilized the remotely sensed data.

The GHG emission will be calculated as the total of carbon stock changes in woody biomass and soil organic carbon and include all major carbon fluxes such as peat decomposition, plantation growth and harvesting, and fires.

To quantify the amount of carbon unit to balance the emission, the Verified Carbon Standard (VCS), the Climate, Community and Biodiversity Standards (CCB), or other internationally accepted standard will be used.

Performance 2022

Progressing

This site is registered on wpml.org as a development site. Switch to a production site key to remove this banner.