作成者:ステークホルダー諮問委員会(SAC) 委員長, ジョセフC.ローソン

エイプリル社の持続可能な森林管理方針第2.0(SFMP2.0)の実施における進捗状況をKPMG Performance Registrar社(KPMG PRI)がまとめた第三者監査報告書が先日完成致しました。エイプリル社の第三者ステークホルダー諮問委員会(SAC)委員長としてその要約版と完全版とを提出致します。

SACはKPMG社に対し、2016年の徹底した監査の実施、およびエイプリル社のSFMP2.0におけるパフォーマンスの評価をステークホルダーが行う際の客観的基盤となるような報告書の作成を委託しました。SACの全メンバーは、監査および報告書を精査した上で、本報告書の委託事項に合意しました。そして、その結果のレビューを既に行いました。

ご存知のように、エイプリル社は2015年6月3日にSFMP2.0を発表し、エイプリル社及びそのサプライヤーの操業に適用される誓約を明記しています。

これらの誓約には、混合広葉樹からの収穫の停止、非森林地のみの開発、最適な森林保全を実現するための景観アプローチの実施、第三者泥炭専門家ワーキンググループ(IPEWG)の設立、そして、地元コミュニティと関わるための様々なプロセスの導入などが含まれています。

KPMG社の報告書は、エイプリル社のSFMP2.0について、導入1年目から2016年6月30日までの同社の進捗状況を第三者が評価し検証するものです。KPMG社は2016年12月に本報告書をSACに提出しました。

この監査を実施し報告書を作成する中で、KPMG 社は、エイプリル社の各操業現場への訪問、同社の報告の方法とデータの見直し、サプライヤーのコンセッションの視察、主要ステークホルダーとの面接、SACとの継続的なコミュニケーションを実施しました。

例として報告書に記載の報告結果を幾つか下記に挙げます。

  1. 森林地域の新たな開発の一時停止は概して、サプライヤーによる法律や規則等における軽微な不適合があったと指摘された。
  2. 工場は2015年12月末までに混合広葉樹のすべての使用を徐々に廃止し、この間、新たなライセンスは取得されなかった。
  3. 現在、およそ421,000ヘクタールのエリアで保護および生態系回復が行われており、そのうちおよそ90%は「森林」と分類される。
  4. エイプリル社はカンパール半島とパダン島の2箇所で景観レベルの計画を開始している。
  5. 現地調査中に観察された泥炭地の開発はすべて、IPEWGによる提言に従って行われていた。
  6. エイプリル社は、国際森林製紙団体協議会(ICFPA)及び空気・蒸気振興評議会(NCASI)が開発し、すでに定着している方法に従って、同社の工場敷地で適用する温室効果ガス排出量データを決めており、今後の改善事項の測定で使えるようにパルプ及び紙の製造における温室効果ガス濃度の基準値を設定していた。
  7. エイプリル社が実施または支援している社会インフラプロジェクトの金銭的価値はおよそ308,000ドルであった。奨学金を提供したのは288人、期間中にRAPP社が契約した中小企業(SME)は172社、期間中になされたステークホルダーとの会議及び関連誓約は1,000件以上(エイプリル社の推定)で、そのうち実現したものや現時点で進行中のものは286件。
  8. 新たに先住民や農村コミュニティと同意書を交わす必要が生じるような新たな開発は行われなかった。2016年に実現した主な誓約は、苦情に対処するための最新の標準業務手順(苦情解決システム)の策定だった。
  9. エイプリル社とその長期サプライヤーは、期間中にコンセッション内で発生した第三者が火元となった火災を273件特定した。しかし、損失は全体としておよそ756ヘクタールのみで、これは2015年にインドネシア国内で火災によって失われた森林が260万ヘクタールであったことを考えると注目に値する。
  10. エイプリル社は、2015年および2016年に、公的にアクセスが可能な持続可能性ポータルサイトをオープンした。現在このポータルサイトには、サプライヤーのリスト、コンセッションの地図、高保護価値(HCV)エリアの情報などが記載されている。

重要なのは、本報告書において、報告期間中にSFMP2.0の要件実施に際し不適合であったケースが3件特定されたことです。そのうち2件はすでに対処済みで、データ収集方法や、SFMP2.0のそれ以外の側面の提示及び実施など、28の改善の機会も特定されました。

この第三者報告書は今後毎年作成され、これら1年目の結果はその次の年の目標を設定し、不適合事項を生じるリスクを最小限に抑え、その改善に取り組む上での基準となります。

SACは引き続き、エイプリル社の誓約の実現と第三者評価の実施について監視するとともに、綿密な調査を実施していきます。

本報告書に対するご質問やコメントがあれば、是非お問い合わせください。


宜しくお願いいたします。

ステークホルダー諮問委員会(SAC)

委員長

ジョセフC.ローソン


ダウンロードはこちらへ

  1. SAC委員長のレター(日本語)
  2. KPMG PRI 報告書概要 (日本語)
  3. KPMG PRI 報告書概要 (英語)
  4. KPMG PRI 報告書概要 (日本語)


svg+xml;charset=utf — APRIL Asia
sustainable growth — APRIL Asia

Method

Waste disposed is recorded through various means of measurement including estimation of weight by waste type. Particular waste types as described above are measured as a wet waste and converted to a bone dry (BD) weight. The wet waste weight is multiplied by the consistency of each waste type to determine the BD. The consistency is predetermined by the lab.

Baseline
71kg/T

Performance 2022

On Track

sustainable growth — APRIL Asia

Method

The DPTW utilisation rate and % of textile waste per tonne of product will be based on R&D lab/pilot/demo procedures.

Baseline
0%

Performance 2022

In Development

sustainable growth — APRIL Asia

Method

Water consumption per tonne of product is calculated based on water consumed in the production of saleable pulp, paper, viscose staple fiber and viscose yarn measured by flow meters, via calculation and water balances divided by the production figures for saleable pulp, paper, viscose staple fibre and viscose yarn.

Baseline
28 m3/T

Performance 2022

Not Progressing

sustainable growth — APRIL Asia

Method

Soda content within the liquor cycle and losses are determined by means of mass balance based on daily lab analysis.

Lime volume in the lime kiln and losses are determined by means of lime make-up.

The recovery rate is calculated net of the percentage of make-up amounts added. The annual figure is based on the average monthly recovery rate.

Baseline
96%

Performance 2022

Not Progressing

inclusive progress — APRIL Asia

Method

Number of Mill and Nursery contractor calculated based on Man Power data which grouped by gender level calculated as a monthly average.

Baseline
2571

inclusive progress — APRIL Asia

Method

The number of own and supply partners employees is calculated based on year-end Man Power data which is grouped by gender. The identification of leadership position refer to employees’ grade D2 or Manager level and above.

Baseline
55 women employees in leadership positions

Performance 2022

Progressing

inclusive progress — APRIL Asia

Method

Women’s effective participation is identified from the participation list for each program. Percentage of female participation is calculated by the number of women participating divided by the total participants.

Baseline
34%

Performance 2022

Progressing

inclusive progress — APRIL Asia

Method

In development

Baseline
In development

Performance 2022

Progressing

inclusive progress — APRIL Asia

Method

In development

Baseline
In development

Performance 2022

Progressing

inclusive progress — APRIL Asia

Method

In development

Baseline
In development

Performance 2022

Progressing

inclusive progress — APRIL Asia

Method

We engaged third party to conduct assessment in APRIL-supported schools using the framework that was developed by Research Triangle Institute (RTI) and USAID.

Baseline
In development

Performance 2022

Progressing

inclusive progress — APRIL Asia

Method

Poverty mapping is identified through:

  1. Desktop analysis using National Statistics, Village Potential Statistics, SMERU Poverty Map.
  2. On-the-ground verification through FGD, village transect walk, interview with community.

Baseline
3%

Performance 2022

Progressing

thriving landscapes — APRIL Asia

Method

Peer-reviewed scientific journal publication standards

Baseline
1

Performance 2022

On Track

thriving landscapes — APRIL Asia

Method

Documentation of Participation (presentation of papers or posters) in national and international dialogues, workshops and conferences

Baseline
6

Performance 2022

On Track

thriving landscapes — APRIL Asia

Method

Number of scientists from universities and research institutions that have collaborated with APRIL on peatland management during the calendar year

Baseline
9

Performance 2022

On Track

thriving landscapes — APRIL Asia

Method

Wood deliveries (excluding open market supply) to the mill are used as a basis to calculate MAI (Tonnes/ Ha/Yr). The MAI is based on the 3 year area weighted rolling average growth for all closed compartments.

Baseline
20T/ha/yr

Performance 2022

On Track

thriving landscapes — APRIL Asia

Method

Methodology to be developed specific to animal species and does not include plants. Qualifying initiatives may vary widely in nature but must have the animal protection as the primary objective.

Partnerships will be developed and documented in line with an overarching strategy prioritizing stakeholders and threats specific to the country of Indonesia assessed.

Performance 2022

Progressing

thriving landscapes — APRIL Asia

Method

May include various initiatives relating to conservation of RTE species to be defined in a priority list, initiatives may be conducted solely or in collaboration with other stakeholders.

Baseline
2

thriving landscapes — APRIL Asia

Method

Methodology to be developed to measure change in ecosystem services and values over time (carbon sequestration, water provision, resource provision including fish and honey)

Baseline
not yet developed

thriving landscapes — APRIL Asia

Method

Reports for reforestation of previously encroached and degraded area including all areas where assisted natural regeneration, planting or enrichment planting of species that improve habitat value have taken place during the year but excludes natural regeneration.

Baseline
275 ha

Performance 2022

Progressing

thriving landscapes — APRIL Asia

Method

Area within conservation is derived from land bank which is based on land cover analysis and is updated annually to capture any boundary changes, land use changes or measurement data.

Baseline
0 ha Net loss

Performance 2022

Not Progressing

thriving landscapes — APRIL Asia

Method

Landscape conservation funding includes restoration and conservation costs associated with the RER as well as the allocation of a proportion of the costs related to APRIL’s maintenance of conservation values under its production-protection model. The allocation is based on proportionate amount of each cost that is related to conservation and restoration.

The wood volume is based on wood delivered to the Mill.

Baseline
USD$0.7 per tonne of plantation fiber

Performance 2022

On Track

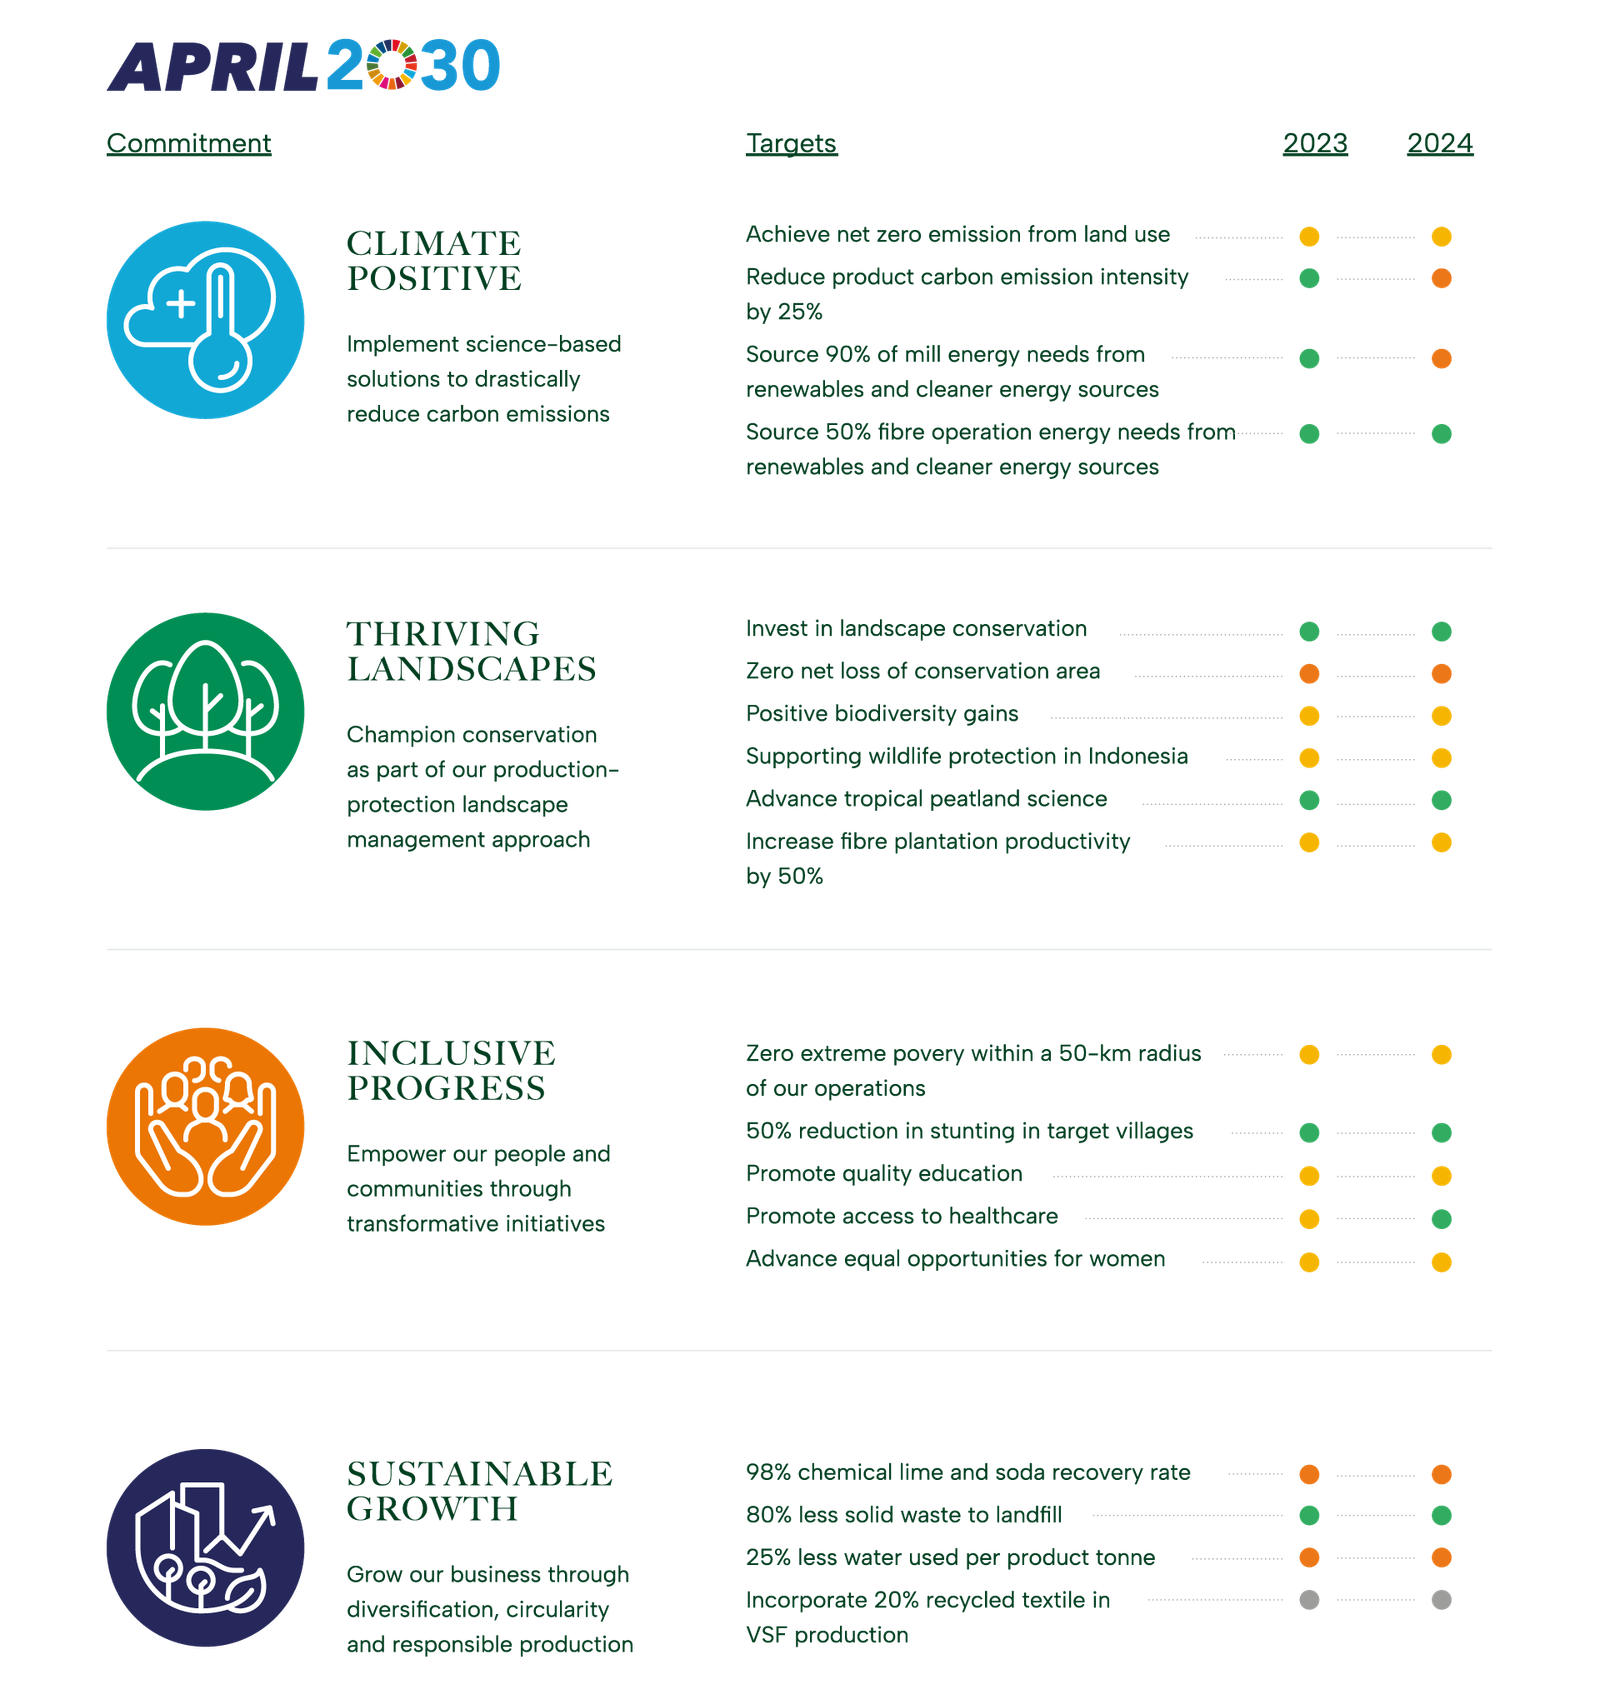
climate positive 1 — APRIL Asia

Method

Mill

Calculate from the records of fuel types used the amount consumed in boilers to generate power, heat and steam including energy use for mobile & including transportation. Each of the fuel types are converted to energy expressed by Giga Joule Lower Heating Value (GJ LHV) following the IPCC guidelines.

Baseline: 87%

Performance 2022

On Track

Forest Operations

Calculate from the records of fuel types the quantity consumed by major categories of forest management activities by Fiber operations.

This covers energy used for Forest operations, infrastructure including wood transport from estate to mill; When a blend of fuel types is used (such as B20) the contribution to renewable and cleaner energy targets is calculated separately for each fuel rather than considering the blend as a cleaner fuel type.

Baseline: 19%

Performance 2022

Progressing

climate positive 1 — APRIL Asia

Method

APRIL follows the international GHG protocol as developed by WRI/WBCSD to develop its emissions profile. The total emissions measured as emissions intensity is calculated based on tonnes of Scope 1 and 2 Mill Greenhouse Gas Emissions per tonne of product (paper, pulp and viscose). The emissions boundary scope covers gate-to-gate (wood processing in wood yard until pulp, paper and viscose production) of the three main GHGs: CO2, CH4, and N2O.

Baseline
0.55 tCO2e/product tonne

Performance 2022

On Track

climate positive 1 — APRIL Asia

Method

To quantify the total GHG emission and removals across APRIL’s land bank from land use, APRIL follows the GHG Protocol Agricultural Guidance and IPCC Guidelines for Agricultural, Forestry, and Other Land Use. To detect the land cover change within the look-back period, i.e. 20 years APRIL utilized the remotely sensed data.

The GHG emission will be calculated as the total of carbon stock changes in woody biomass and soil organic carbon and include all major carbon fluxes such as peat decomposition, plantation growth and harvesting, and fires.

To quantify the amount of carbon unit to balance the emission, the Verified Carbon Standard (VCS), the Climate, Community and Biodiversity Standards (CCB), or other internationally accepted standard will be used.

Performance 2022

Progressing

This site is registered on wpml.org as a development site. Switch to a production site key to remove this banner.