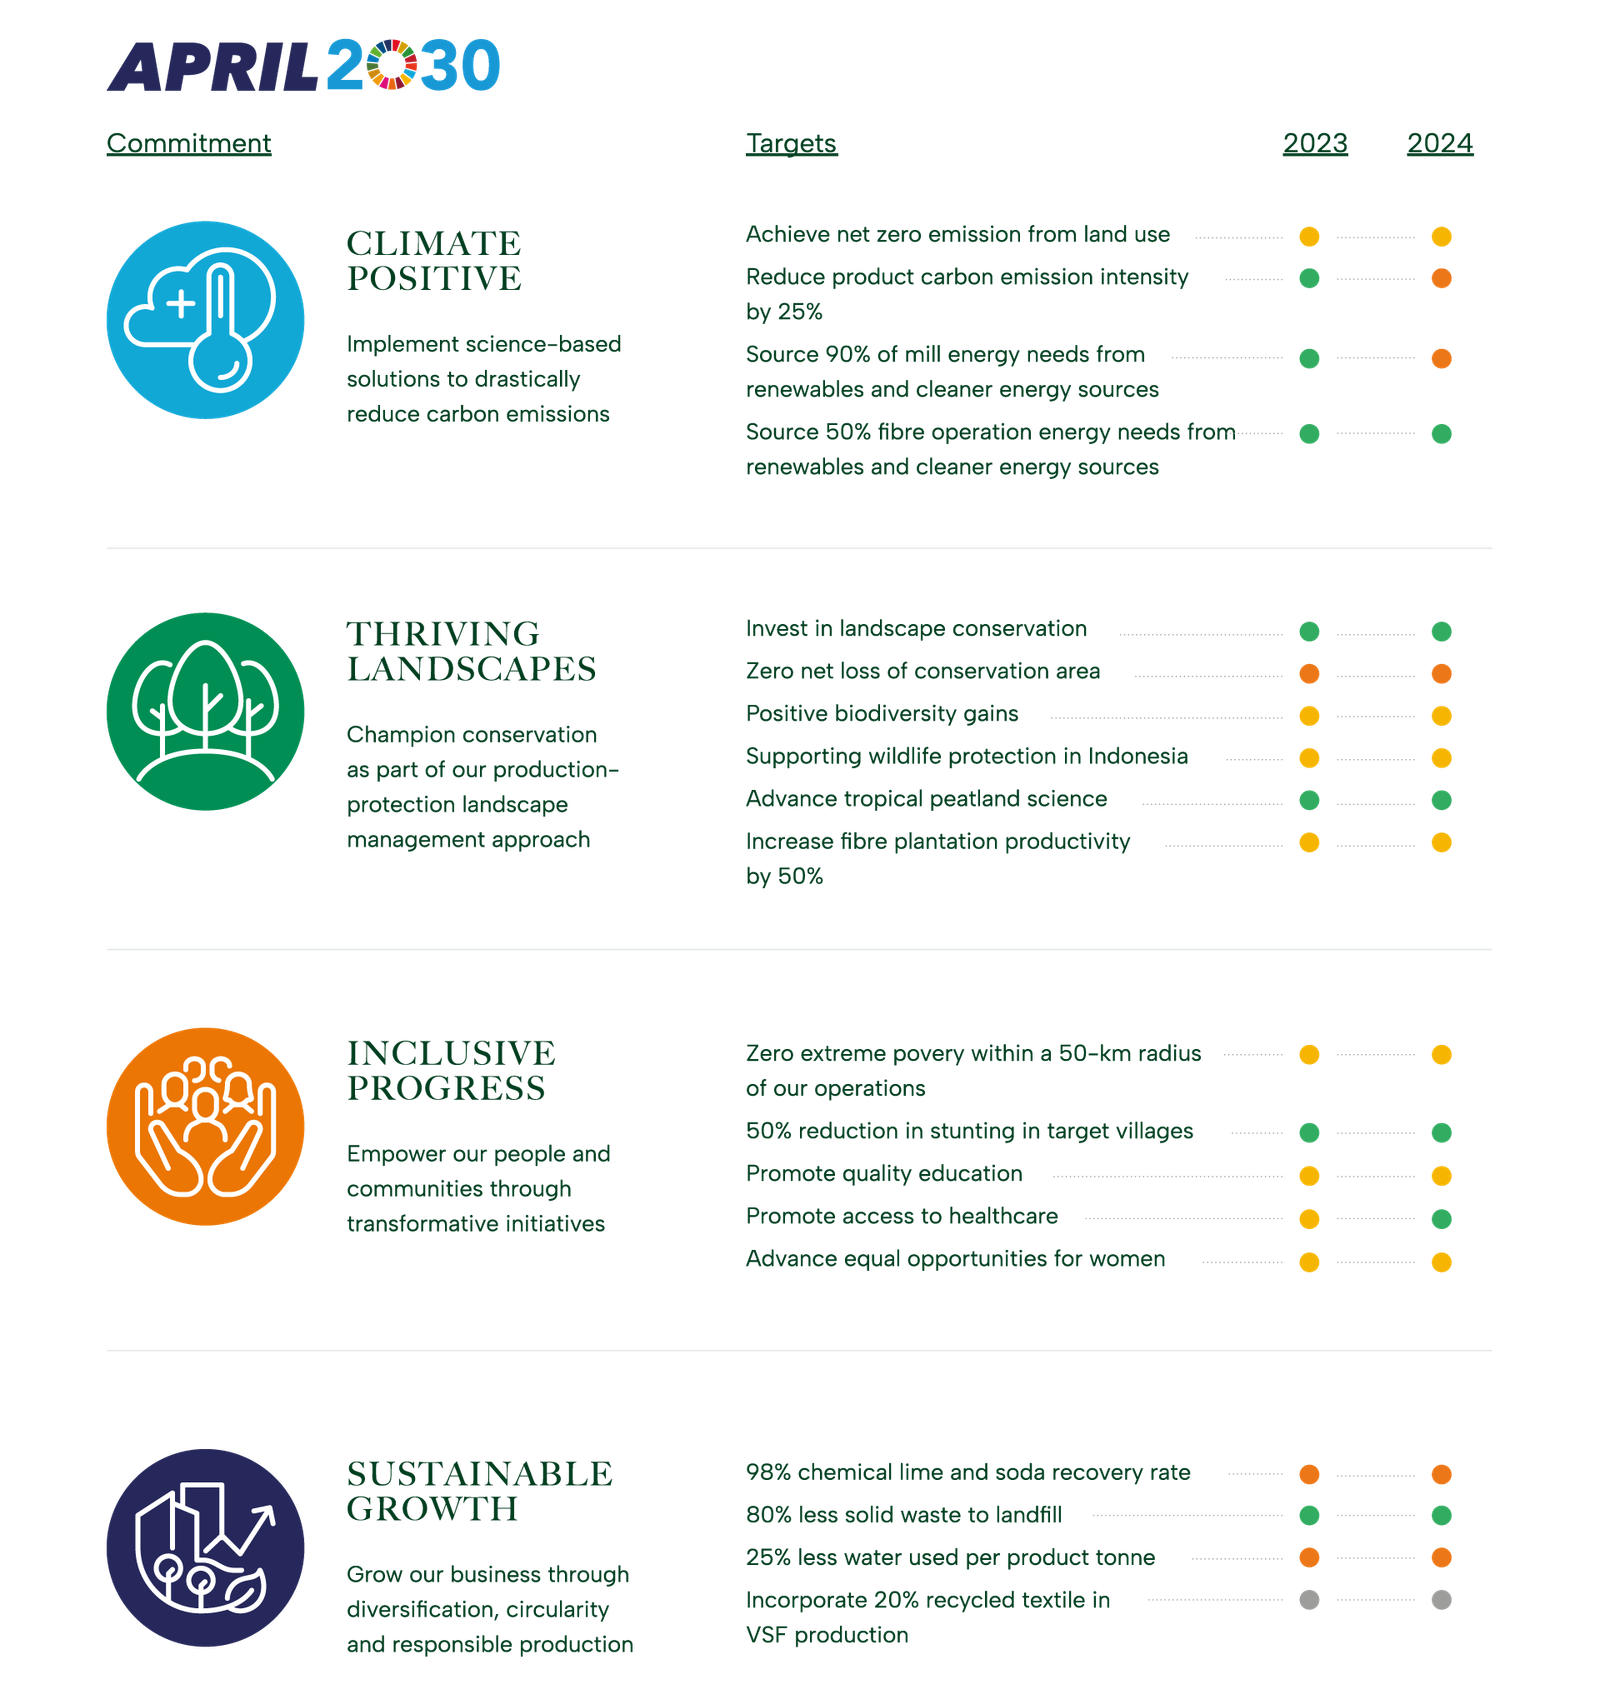
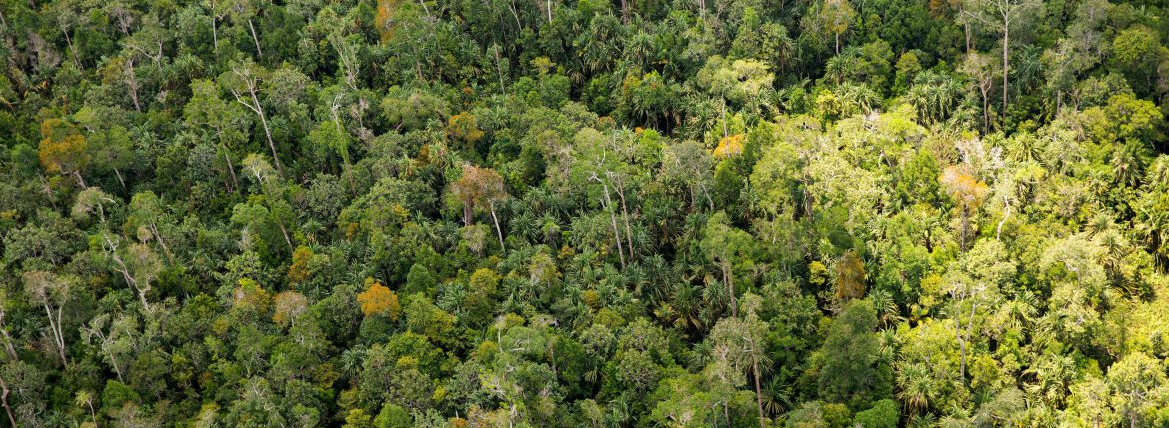
Sebagai bagian dari Kebijakan APRIL Dalam Pengelolaan Hutan Berkelanjutan 2.0. (SFMP 2.0), APRIL berkomitmen untuk tidak melakukan deforestasi dan melindungi serta mengelola secara aktif hutan konservasi dan restorasi. Hal ini merupakan kunci dari komitmen 1 banding 1 APRIL, di mana perusahaan melakukan konservasi satu hektar untuk setiap hektar hutan tanaman industri. Sejauh ini, perusahaan telah memenuhi 81% dari target tersebut, dengan luas total konservasi dan restorasi ekosistem sekitar 370.000 hektar. Kinerja perusahaan, baik dalam melakukan komitmen ini ataupun lainya di bawah SFMP 2.0. diawasi secara independen oleh Komite Penasihat Pemangku Kepentingan dan diverifikasi setiap tahun oleh KPMG PRI, dimana hasil dari audit tersebut terbuka untuk umum.

Kebijakan APRIL juga meliputi bagaimana perusahaan mengadopsi High Conservation Value (HCV) dan High Carbon Stock Approach (HCSA), yakni dua metodologi yang diterima secara luas di industri pertanian dan kehutanan serta didukung oleh LSM global, termasuk Greenpeace dan WWF. HCV juga termasuk dalam standar sertifikasi pengelolaan hutan global seperti Forest Stewardship Council, serta HCV dan HCS telah dikembangkan melalui proses konsultasi melibatkan multi-stakeholder yang komprehensif.

Hutan Purba dan Langka Menurut Canopy

Canopy, LSM yang berpusat di Kanada, melalui Audit CanopyStyle mereka, berusaha untuk meniadakan fibre yang dihasilkan dari apa yang mereka sebut sebagai “Hutan Purba dan Terancam Punah” (AEF) yang dianggap sebagai sumber yang kontroversial atau berisiko tinggi.

Canopy secara umum mendefinisikan AEF sebagai mosaik lanskap hutan utuh (berdasarkan HCV 2), tipe hutan yang langka (berdasarkan HCV 3), tipe hutan yang menjadi langka karena aktivitas manusia (berdasarkan HCV 3), hutan dengan kekayaan spesies yang tinggi, hutan dengan konsentrasi spesies langka dan terancam punah yang tinggi, hutan yang memiliki jenis endemik yang tinggi, habitat inti bagi spesies fokal, atau hutan yang menunjukkan fenomena ekologi dan evolusi yang langka (berdasarkan HCV 1, 2 & 3).

Mengacu kepada definisi ini, Canopy telah memetakan apa yang mereka anggap sebagai AEF dengan menggunakan 9 layer (lapisan) peta lainnya – yang tercantum di bawah – yang ketika ditumpangtindihkan akan menentukan penerapan AEF tersebut. Jika suatu daerah diklasifikasikan sebagai AEF, maka artinya setidaknya satu dari sekian banyak komponen ekologi atau nilai ekologis ditemukan dalam kawasan tersebut. Salah satu layer peta tersebut memiliki resolusi spasial 100 km x 100 km atau 10.000 km2. Resolusi ini jauh lebih rendah dari yang diperlukan untuk dapat mendefinisikan kerumitan lanskap hutan secara global.

Penting untuk dilakukan klarifikasi bahwa APRIL tidak mempertanyakan sumber data atau menganggap adanya ketidakakuratan secara ‘faktual’ atau kesalahan dari Pemetaan AEF. Namun, APRIL percaya bahwa tingkat ketelitian yang rendah yang tercipta akibat kurangnya resolusi spasial yang detil telah melemahkan penerapan AEF dalam konteks Indonesia. Oleh karena itu, hampir seluruh pulau Sumatera, misalnya, dengan populasi lebih dari 50 juta orang, dapat dianggap sebagai AEF (lihat Peta 1).
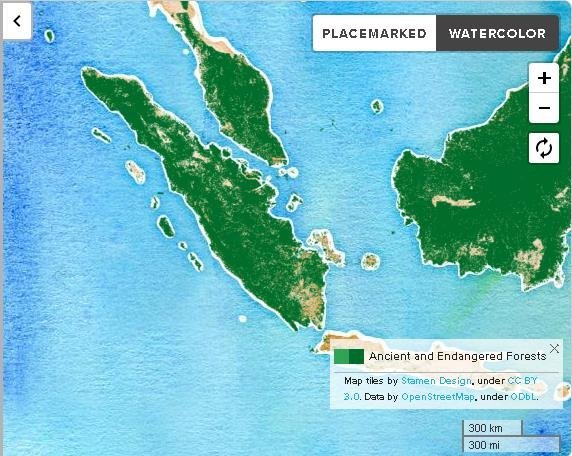
Map 1 1 — APRIL Asia

Peta 1. Canopy AEF (sumber: https://canopyplanet.org/tools/forestmapper/app/)

Peta resolusi rendah ini juga mengkategorikan sebagian besar dari wilayah Indonesia dan Malaysia sebagai AEF. Hal ini juga perlu dicatat bahwa ada kekurangan AEF secara umum sebagaimana didefinisikan oleh Canopy di Eropa atau negara OECD lainnya (lihat Peta 2)
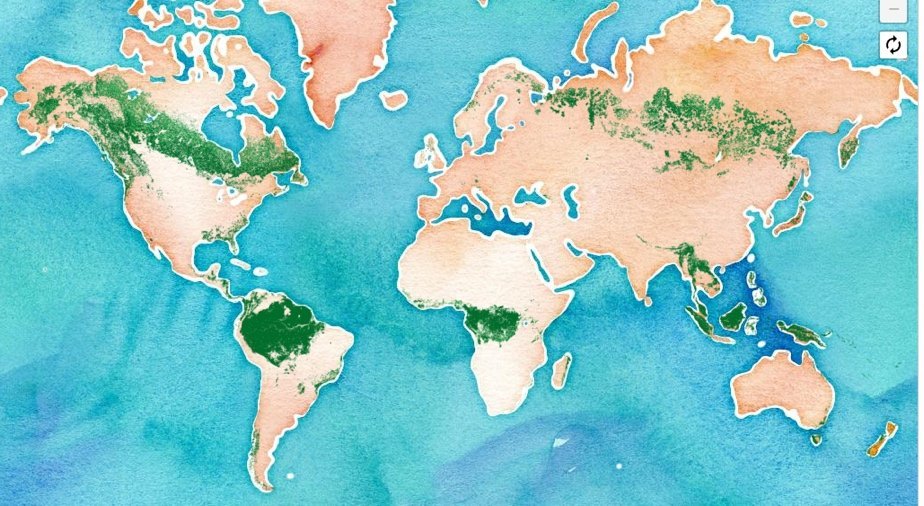
Map 2 1 — APRIL Asia

Peta 2. Canopy AEF Global (sumber: https://canopyplanet.org/tools/forestmapper/app/)

Apakah artinya?

Berdasarkan interpretasinya, Canopy menunjukkan bahwa daerah yang mereka definisikan sebagai AEF merupakan sumber yang berisiko tinggi.  Akan tetapi, interpretasi ini menyimpulkan bahwa setiap sumber yang didapat dari daerah ekonomi yang berkembang seperti Sumatera, Indonesia secara inheren berisiko, yang tentunya mengabaikan realita dan perbedaan saat ini di lapangan. Sudah jelas bahwa mengikuti pendekatan atau prinsip pengecualian tidak mencerminkan kompleksitas berbagai lanskap dalam penggunaan berbagai lahan, hak masyarakat dan kebutuhan sosio-ekonomi suatu negara yang harus diakui dan seimbang dengan kebutuhan ekologis.

Meskipun kami mendukung pengembangan pemetaan dan perangkat lain yang dapat memandu dan memungkinkan pengelolaan hutan berkelanjutan di Indonesia dan juga secara global, kami percaya alat ini hanya dapat menjadi efektif jika mereka:

  • Menyertakan analisis ilmiah yang terperinci dan kuat setelah dilakukan tahap peer review oleh ahli yang sebelumnya telah mendukung dalam pengembangan kebijakan, praktik dan hasil pengelolaan hutan berkelanjutan secara langsung di lapangan baik di Indonesia maupun di seluruh dunia.
  • Menggunakan resolusi spasial yang lebih tinggi guna meningkatkan ketepatan dan kredibilitas alat-alat.
  • Muncul dari proses konsultasi multi-stakeholder yang terbuka dan transparan.
  • Memiliki daya tarik yang luas dan dukungan yang kuat dari sertifikasi hutan global atau kerangka jaminan dan organisasi masyarakat sipil.

Dalam pandangan kami, alat-alat seperti Forest Mapper jika memenuhi kriteria-kriteria tersebut, akan dianggap kredibel, relevan, dan seimbang dalam penilaiannya terhadap Indonesia, Malaysia serta daerah-daerah lain sebagai produsen viscose berkelanjutan maupun produsen komoditas lainnya.

APRIL mengakui bahwa melindungi Hutan Bernilai Konservasi Tinggi di Indonesia adalah hal yang sangat penting dan oleh karena itu telah membuat komitmen khusus untuk melindungi daerah-daerah tersebut sebagai bagian dari kebijakannya. Perlindungan tersebut juga membentuk dasar Kerangka Kerja Pengelolaan Konservasi APRIL di lanskap hutan tanaman industri serta komitmennya untuk merestorasi dan menkonservasikan 150.000 hektar hutan lahan gambut ekologis penting sebagai bagian dari program Restorasi Ekosistem Riau. Inisiatif ini menunjukkan kepada para pemangku kepentingan dan kepada Canopy bahwa APRIL memang ‘melakukan proses perencanaan konservasi yang kuat’ dan bahwa perusahaan mengambil kewajiban konservasi secara serius.

Sumber Data Pemetaan:

  1. Tiger Distribution (Wildlife Cons. Soc, WWF, Smithsonian Inst. Save the Tiger Fund, 2017);
  2. Elephant Distribution (WWF via The Guardian, 2012);
  3. Biodiversity Hotspots (Conservation Intl, 2011);
  4. Mammal Species Richness (Biod. Map Org, 2013);
  5. Threatened Mammals (Biod. Map Org, 2013);
  6. Bird Species Richness (Biod. Map Org, 2013);
  7. Threatened Birds (Biod. Map Org, 2013);
  8. Soil Carbon Density (WRI, 2017)
  9. Forest Carbon Density (various, 2016)

Referensi

http://canopyplanet.org/wp-content/uploads/2015/03/Wye-EF-Report.pdf
Canopy Ancient and Endangered Forest: https://canopyplanet.org/solutions/ancient-forest-friendly/ancient-forest-friendly-defined/
Intact Forest Landscapes: http://www.intactforests.org/index.html

svg+xml;charset=utf — APRIL Asia
sustainable growth — APRIL Asia

Method

Waste disposed is recorded through various means of measurement including estimation of weight by waste type. Particular waste types as described above are measured as a wet waste and converted to a bone dry (BD) weight. The wet waste weight is multiplied by the consistency of each waste type to determine the BD. The consistency is predetermined by the lab.

Baseline
71kg/T

Performance 2022

On Track

sustainable growth — APRIL Asia

Method

The DPTW utilisation rate and % of textile waste per tonne of product will be based on R&D lab/pilot/demo procedures.

Baseline
0%

Performance 2022

In Development

sustainable growth — APRIL Asia

Method

Water consumption per tonne of product is calculated based on water consumed in the production of saleable pulp, paper, viscose staple fiber and viscose yarn measured by flow meters, via calculation and water balances divided by the production figures for saleable pulp, paper, viscose staple fibre and viscose yarn.

Baseline
28 m3/T

Performance 2022

Not Progressing

sustainable growth — APRIL Asia

Method

Soda content within the liquor cycle and losses are determined by means of mass balance based on daily lab analysis.

Lime volume in the lime kiln and losses are determined by means of lime make-up.

The recovery rate is calculated net of the percentage of make-up amounts added. The annual figure is based on the average monthly recovery rate.

Baseline
96%

Performance 2022

Not Progressing

inclusive progress — APRIL Asia

Method

Number of Mill and Nursery contractor calculated based on Man Power data which grouped by gender level calculated as a monthly average.

Baseline
2571

inclusive progress — APRIL Asia

Method

The number of own and supply partners employees is calculated based on year-end Man Power data which is grouped by gender. The identification of leadership position refer to employees’ grade D2 or Manager level and above.

Baseline
55 women employees in leadership positions

Performance 2022

Progressing

inclusive progress — APRIL Asia

Method

Women’s effective participation is identified from the participation list for each program. Percentage of female participation is calculated by the number of women participating divided by the total participants.

Baseline
34%

Performance 2022

Progressing

inclusive progress — APRIL Asia

Method

In development

Baseline
In development

Performance 2022

Progressing

inclusive progress — APRIL Asia

Method

In development

Baseline
In development

Performance 2022

Progressing

inclusive progress — APRIL Asia

Method

In development

Baseline
In development

Performance 2022

Progressing

inclusive progress — APRIL Asia

Method

We engaged third party to conduct assessment in APRIL-supported schools using the framework that was developed by Research Triangle Institute (RTI) and USAID.

Baseline
In development

Performance 2022

Progressing

inclusive progress — APRIL Asia

Method

Poverty mapping is identified through:

  1. Desktop analysis using National Statistics, Village Potential Statistics, SMERU Poverty Map.
  2. On-the-ground verification through FGD, village transect walk, interview with community.

Baseline
3%

Performance 2022

Progressing

thriving landscapes — APRIL Asia

Method

Peer-reviewed scientific journal publication standards

Baseline
1

Performance 2022

On Track

thriving landscapes — APRIL Asia

Method

Documentation of Participation (presentation of papers or posters) in national and international dialogues, workshops and conferences

Baseline
6

Performance 2022

On Track

thriving landscapes — APRIL Asia

Method

Number of scientists from universities and research institutions that have collaborated with APRIL on peatland management during the calendar year

Baseline
9

Performance 2022

On Track

thriving landscapes — APRIL Asia

Method

Wood deliveries (excluding open market supply) to the mill are used as a basis to calculate MAI (Tonnes/ Ha/Yr). The MAI is based on the 3 year area weighted rolling average growth for all closed compartments.

Baseline
20T/ha/yr

Performance 2022

On Track

thriving landscapes — APRIL Asia

Method

Methodology to be developed specific to animal species and does not include plants. Qualifying initiatives may vary widely in nature but must have the animal protection as the primary objective.

Partnerships will be developed and documented in line with an overarching strategy prioritizing stakeholders and threats specific to the country of Indonesia assessed.

Performance 2022

Progressing

thriving landscapes — APRIL Asia

Method

May include various initiatives relating to conservation of RTE species to be defined in a priority list, initiatives may be conducted solely or in collaboration with other stakeholders.

Baseline
2

thriving landscapes — APRIL Asia

Method

Methodology to be developed to measure change in ecosystem services and values over time (carbon sequestration, water provision, resource provision including fish and honey)

Baseline
not yet developed

thriving landscapes — APRIL Asia

Method

Reports for reforestation of previously encroached and degraded area including all areas where assisted natural regeneration, planting or enrichment planting of species that improve habitat value have taken place during the year but excludes natural regeneration.

Baseline
275 ha

Performance 2022

Progressing

thriving landscapes — APRIL Asia

Method

Area within conservation is derived from land bank which is based on land cover analysis and is updated annually to capture any boundary changes, land use changes or measurement data.

Baseline
0 ha Net loss

Performance 2022

Not Progressing

thriving landscapes — APRIL Asia

Method

Landscape conservation funding includes restoration and conservation costs associated with the RER as well as the allocation of a proportion of the costs related to APRIL’s maintenance of conservation values under its production-protection model. The allocation is based on proportionate amount of each cost that is related to conservation and restoration.

The wood volume is based on wood delivered to the Mill.

Baseline
USD$0.7 per tonne of plantation fiber

Performance 2022

On Track

climate positive 1 — APRIL Asia

Method

Mill

Calculate from the records of fuel types used the amount consumed in boilers to generate power, heat and steam including energy use for mobile & including transportation. Each of the fuel types are converted to energy expressed by Giga Joule Lower Heating Value (GJ LHV) following the IPCC guidelines.

Baseline: 87%

Performance 2022

On Track

Forest Operations

Calculate from the records of fuel types the quantity consumed by major categories of forest management activities by Fiber operations.

This covers energy used for Forest operations, infrastructure including wood transport from estate to mill; When a blend of fuel types is used (such as B20) the contribution to renewable and cleaner energy targets is calculated separately for each fuel rather than considering the blend as a cleaner fuel type.

Baseline: 19%

Performance 2022

Progressing

climate positive 1 — APRIL Asia

Method

APRIL follows the international GHG protocol as developed by WRI/WBCSD to develop its emissions profile. The total emissions measured as emissions intensity is calculated based on tonnes of Scope 1 and 2 Mill Greenhouse Gas Emissions per tonne of product (paper, pulp and viscose). The emissions boundary scope covers gate-to-gate (wood processing in wood yard until pulp, paper and viscose production) of the three main GHGs: CO2, CH4, and N2O.

Baseline
0.55 tCO2e/product tonne

Performance 2022

On Track

climate positive 1 — APRIL Asia

Method

To quantify the total GHG emission and removals across APRIL’s land bank from land use, APRIL follows the GHG Protocol Agricultural Guidance and IPCC Guidelines for Agricultural, Forestry, and Other Land Use. To detect the land cover change within the look-back period, i.e. 20 years APRIL utilized the remotely sensed data.

The GHG emission will be calculated as the total of carbon stock changes in woody biomass and soil organic carbon and include all major carbon fluxes such as peat decomposition, plantation growth and harvesting, and fires.

To quantify the amount of carbon unit to balance the emission, the Verified Carbon Standard (VCS), the Climate, Community and Biodiversity Standards (CCB), or other internationally accepted standard will be used.

Performance 2022

Progressing

This site is registered on wpml.org as a development site. Switch to a production site key to remove this banner.