Cari

Kerinci has grown as a result of APRIL Group's presence

Just over 25 years ago, the town of Kerinci on the Indonesian island of Sumatra was home to just 200 dwellings. There were no roads so the only access was on foot or by boat, and most inhabitants made a living as fishermen or illegal loggers.

Today the town is home to over 100,000 people, it has a small airport and two ports, and its produce is used by millions of consumers in countries around the world.

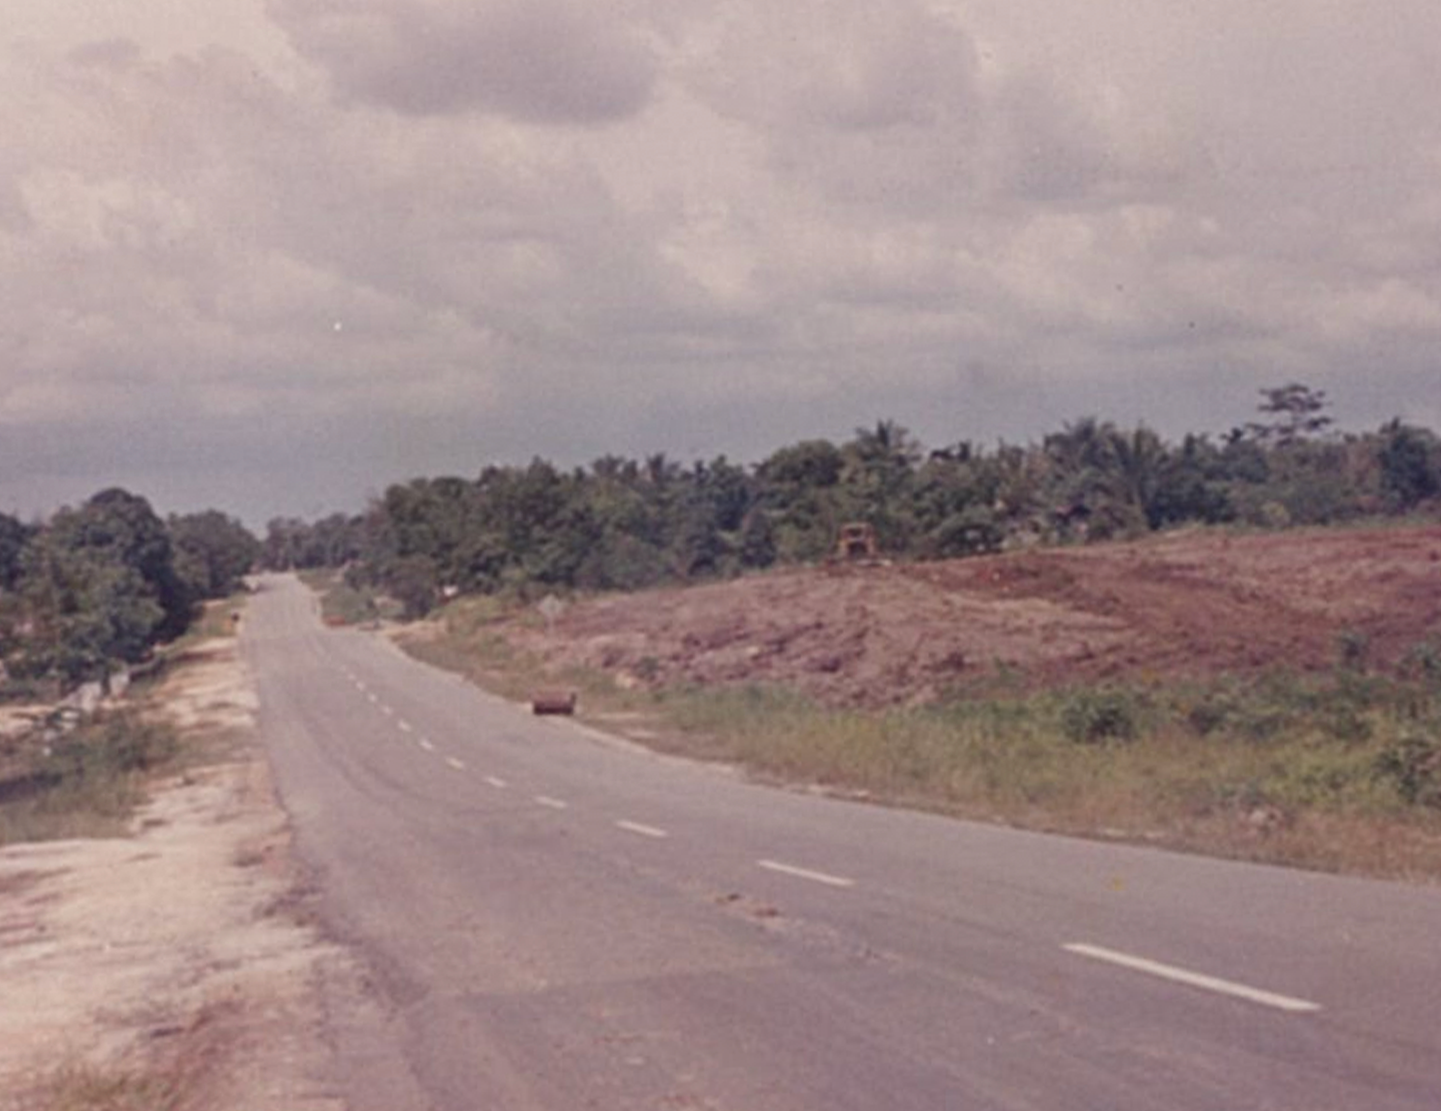
This little-used road is now a thriving market lined with businesses

So what changed?

In 1993 APRIL Group began construction on its first pulp and paper mill in the area. Although it was sparsely populated, Kerinci had ready access to abundant raw materials that would soon transform the economic prospects of the entire area.

Commercial pulp production began in 1995, followed by commercial paper production in 1998. 

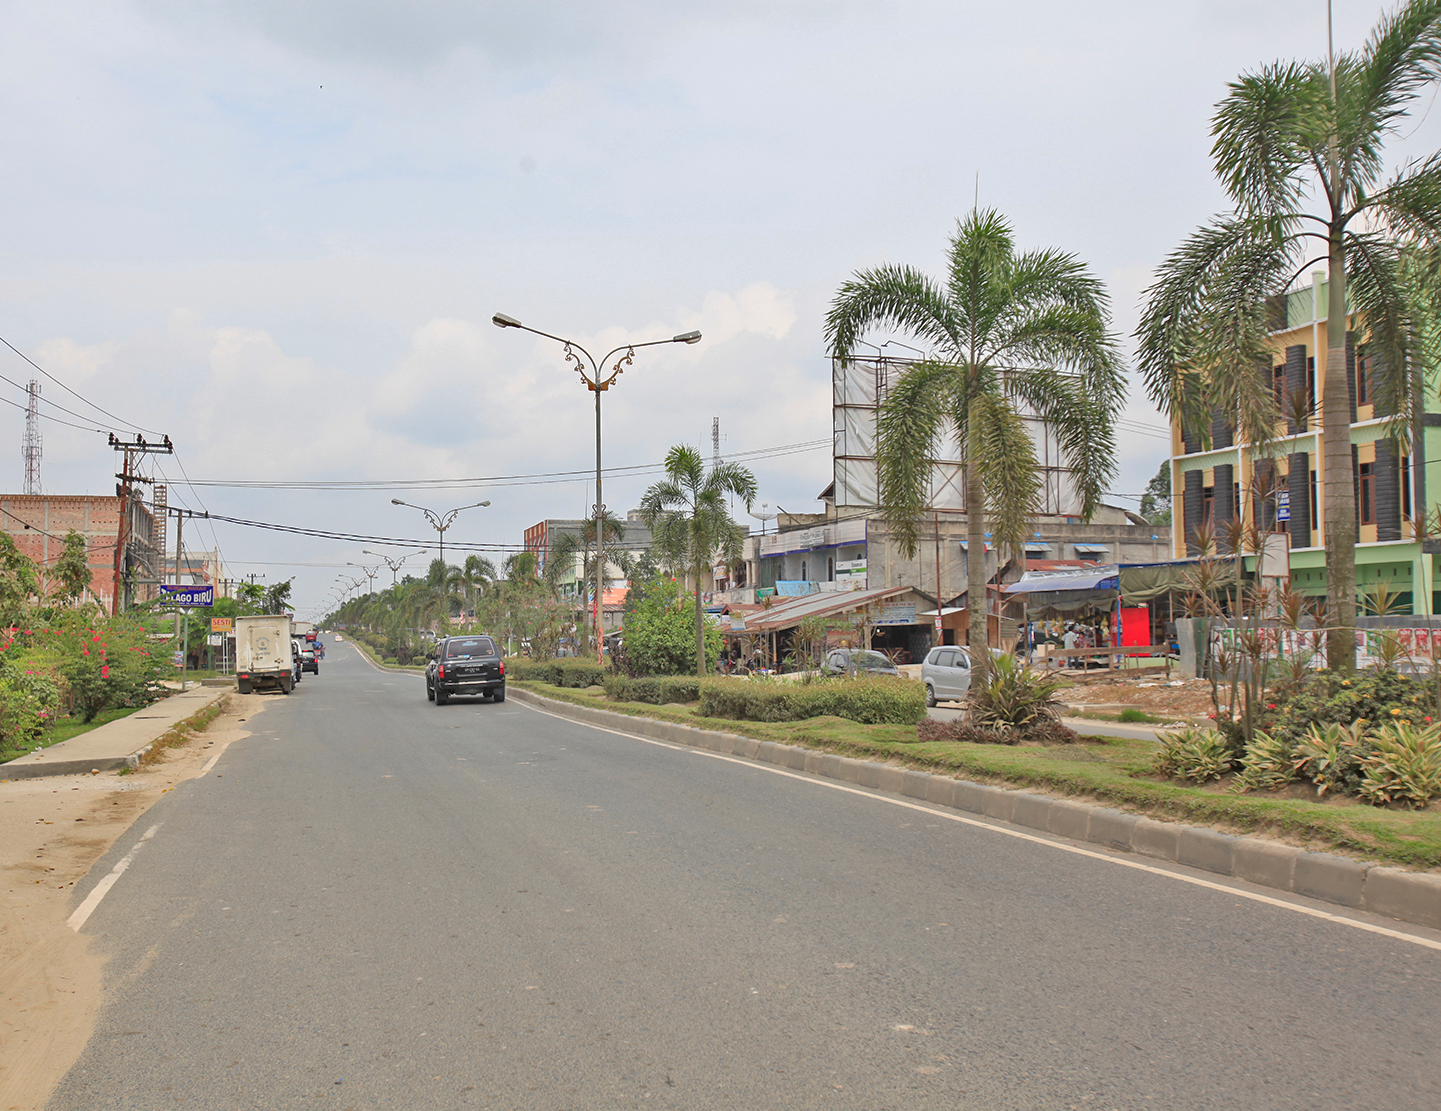
Today the area is almost unrecognizable from that sleepy village. There are 11,000 kilometres of roads, as well as shops, hotels and schools.

APRIL Group employs around 5,800 people directly, and the multiplier effect is estimated at around 90,000. In fact a 1999-2014 study by the Institute of Economic and Social Research – Faculty of Economics and Business, University of Indonesia estimated APRIL’s historic contribution to Riau province’s GDP at 5.2%. APRIL also works with local entrepreneurs to provide them with skills and equipment to build up their businesses and create jobs.


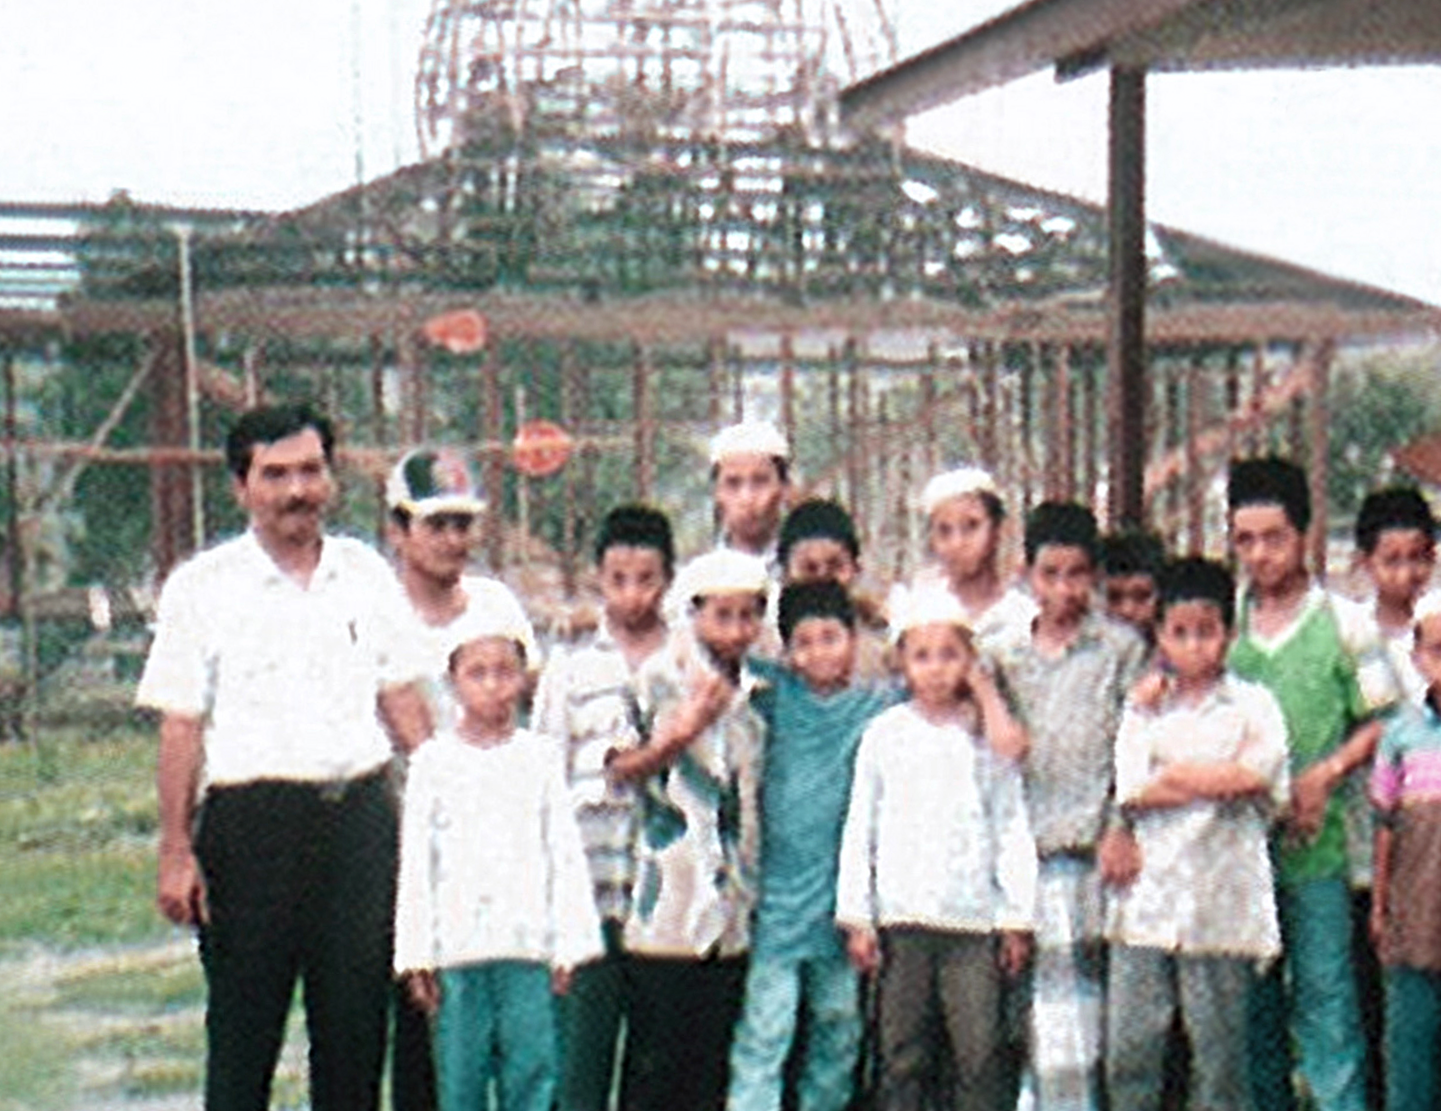
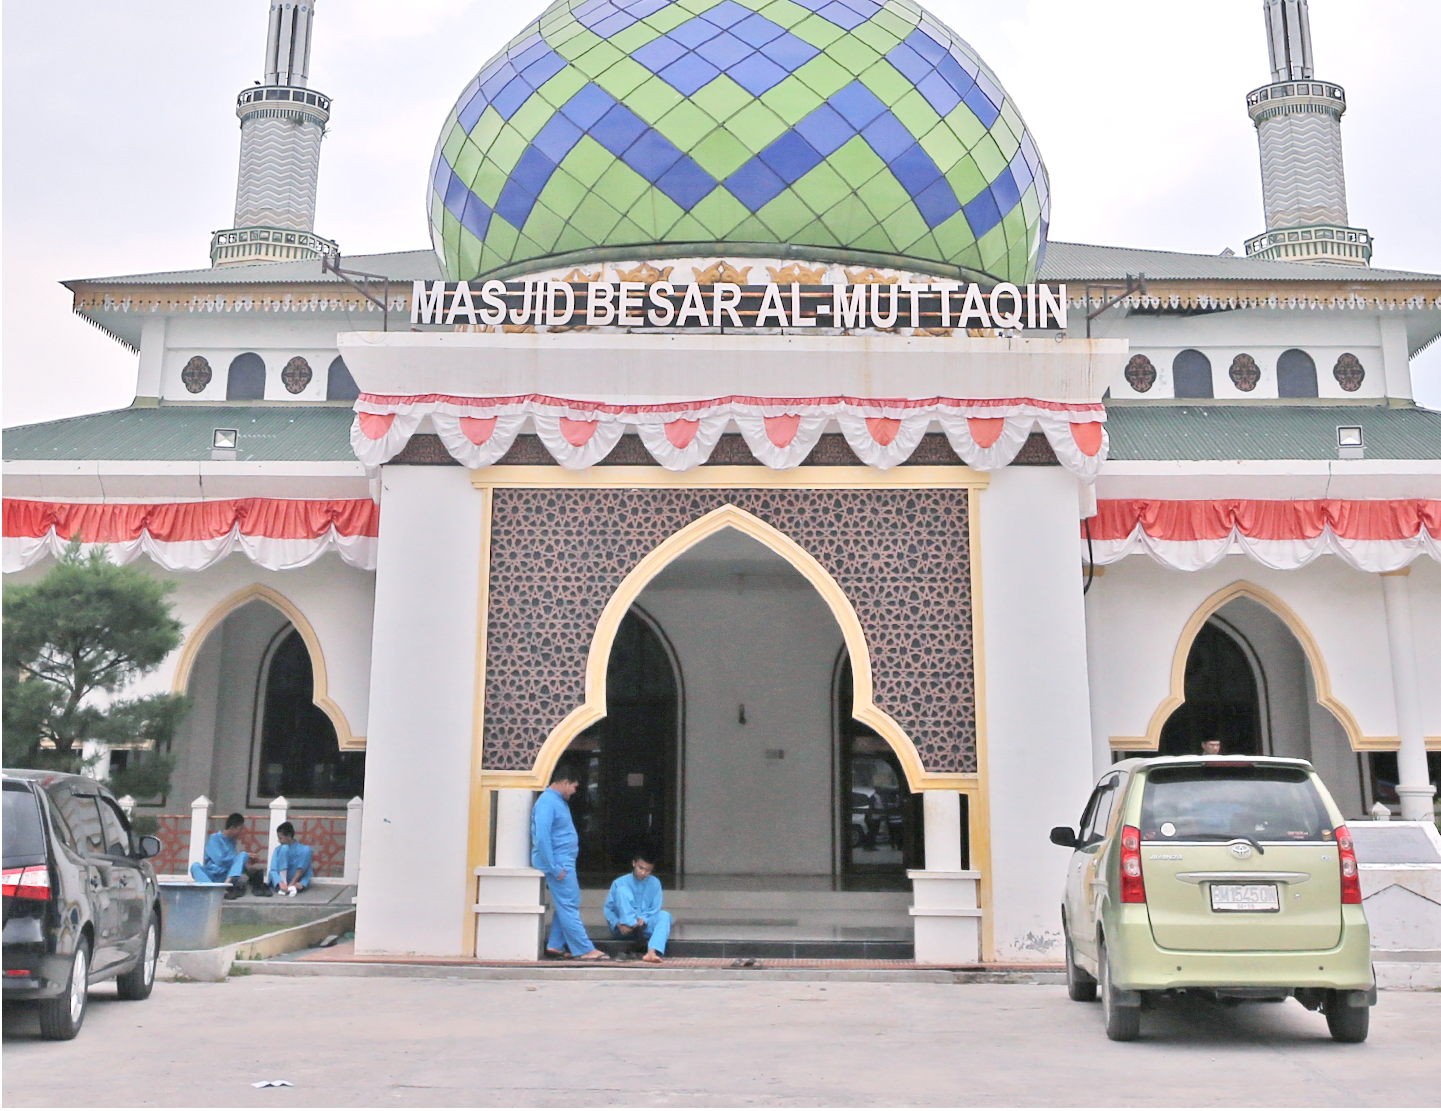
Community facilities such as this mosque have been built throughout the town

It’s not just infrastructure and economic opportunities – APRIL has also helped build a community. As of 2016 APRIL had helped build 36 sports facilities, 556 places of worship and religious schools, and provided equipment to 139 public schools.

APRIL has even provided support to promising young athletes through its Future Athlete Training Center, some of whom have gone on to represent the company in international competitions.

The commitment to helping Kerinci grow is part of our founder’s 5C principles that our activities should be good for Community, Country, Climate and Customer, and only then will they be good for the Company.


svg+xml;charset=utf — APRIL Asia
sustainable growth — APRIL Asia

Method

Waste disposed is recorded through various means of measurement including estimation of weight by waste type. Particular waste types as described above are measured as a wet waste and converted to a bone dry (BD) weight. The wet waste weight is multiplied by the consistency of each waste type to determine the BD. The consistency is predetermined by the lab.

Baseline
71kg/T

Performance 2022

On Track

sustainable growth — APRIL Asia

Method

The DPTW utilisation rate and % of textile waste per tonne of product will be based on R&D lab/pilot/demo procedures.

Baseline
0%

Performance 2022

In Development

sustainable growth — APRIL Asia

Method

Water consumption per tonne of product is calculated based on water consumed in the production of saleable pulp, paper, viscose staple fiber and viscose yarn measured by flow meters, via calculation and water balances divided by the production figures for saleable pulp, paper, viscose staple fibre and viscose yarn.

Baseline
28 m3/T

Performance 2022

Not Progressing

sustainable growth — APRIL Asia

Method

Soda content within the liquor cycle and losses are determined by means of mass balance based on daily lab analysis.

Lime volume in the lime kiln and losses are determined by means of lime make-up.

The recovery rate is calculated net of the percentage of make-up amounts added. The annual figure is based on the average monthly recovery rate.

Baseline
96%

Performance 2022

Not Progressing

inclusive progress — APRIL Asia

Method

Number of Mill and Nursery contractor calculated based on Man Power data which grouped by gender level calculated as a monthly average.

Baseline
2571

inclusive progress — APRIL Asia

Method

The number of own and supply partners employees is calculated based on year-end Man Power data which is grouped by gender. The identification of leadership position refer to employees’ grade D2 or Manager level and above.

Baseline
55 women employees in leadership positions

Performance 2022

Progressing

inclusive progress — APRIL Asia

Method

Women’s effective participation is identified from the participation list for each program. Percentage of female participation is calculated by the number of women participating divided by the total participants.

Baseline
34%

Performance 2022

Progressing

inclusive progress — APRIL Asia

Method

In development

Baseline
In development

Performance 2022

Progressing

inclusive progress — APRIL Asia

Method

In development

Baseline
In development

Performance 2022

Progressing

inclusive progress — APRIL Asia

Method

In development

Baseline
In development

Performance 2022

Progressing

inclusive progress — APRIL Asia

Method

We engaged third party to conduct assessment in APRIL-supported schools using the framework that was developed by Research Triangle Institute (RTI) and USAID.

Baseline
In development

Performance 2022

Progressing

inclusive progress — APRIL Asia

Method

Poverty mapping is identified through:

  1. Desktop analysis using National Statistics, Village Potential Statistics, SMERU Poverty Map.
  2. On-the-ground verification through FGD, village transect walk, interview with community.

Baseline
3%

Performance 2022

Progressing

thriving landscapes — APRIL Asia

Method

Peer-reviewed scientific journal publication standards

Baseline
1

Performance 2022

On Track

thriving landscapes — APRIL Asia

Method

Documentation of Participation (presentation of papers or posters) in national and international dialogues, workshops and conferences

Baseline
6

Performance 2022

On Track

thriving landscapes — APRIL Asia

Method

Number of scientists from universities and research institutions that have collaborated with APRIL on peatland management during the calendar year

Baseline
9

Performance 2022

On Track

thriving landscapes — APRIL Asia

Method

Wood deliveries (excluding open market supply) to the mill are used as a basis to calculate MAI (Tonnes/ Ha/Yr). The MAI is based on the 3 year area weighted rolling average growth for all closed compartments.

Baseline
20T/ha/yr

Performance 2022

On Track

thriving landscapes — APRIL Asia

Method

Methodology to be developed specific to animal species and does not include plants. Qualifying initiatives may vary widely in nature but must have the animal protection as the primary objective.

Partnerships will be developed and documented in line with an overarching strategy prioritizing stakeholders and threats specific to the country of Indonesia assessed.

Performance 2022

Progressing

thriving landscapes — APRIL Asia

Method

May include various initiatives relating to conservation of RTE species to be defined in a priority list, initiatives may be conducted solely or in collaboration with other stakeholders.

Baseline
2

thriving landscapes — APRIL Asia

Method

Methodology to be developed to measure change in ecosystem services and values over time (carbon sequestration, water provision, resource provision including fish and honey)

Baseline
not yet developed

thriving landscapes — APRIL Asia

Method

Reports for reforestation of previously encroached and degraded area including all areas where assisted natural regeneration, planting or enrichment planting of species that improve habitat value have taken place during the year but excludes natural regeneration.

Baseline
275 ha

Performance 2022

Progressing

thriving landscapes — APRIL Asia

Method

Area within conservation is derived from land bank which is based on land cover analysis and is updated annually to capture any boundary changes, land use changes or measurement data.

Baseline
0 ha Net loss

Performance 2022

Not Progressing

thriving landscapes — APRIL Asia

Method

Landscape conservation funding includes restoration and conservation costs associated with the RER as well as the allocation of a proportion of the costs related to APRIL’s maintenance of conservation values under its production-protection model. The allocation is based on proportionate amount of each cost that is related to conservation and restoration.

The wood volume is based on wood delivered to the Mill.

Baseline
USD$0.7 per tonne of plantation fiber

Performance 2022

On Track

climate positive 1 — APRIL Asia

Method

Mill

Calculate from the records of fuel types used the amount consumed in boilers to generate power, heat and steam including energy use for mobile & including transportation. Each of the fuel types are converted to energy expressed by Giga Joule Lower Heating Value (GJ LHV) following the IPCC guidelines.

Baseline: 87%

Performance 2022

On Track

Forest Operations

Calculate from the records of fuel types the quantity consumed by major categories of forest management activities by Fiber operations.

This covers energy used for Forest operations, infrastructure including wood transport from estate to mill; When a blend of fuel types is used (such as B20) the contribution to renewable and cleaner energy targets is calculated separately for each fuel rather than considering the blend as a cleaner fuel type.

Baseline: 19%

Performance 2022

Progressing

climate positive 1 — APRIL Asia

Method

APRIL follows the international GHG protocol as developed by WRI/WBCSD to develop its emissions profile. The total emissions measured as emissions intensity is calculated based on tonnes of Scope 1 and 2 Mill Greenhouse Gas Emissions per tonne of product (paper, pulp and viscose). The emissions boundary scope covers gate-to-gate (wood processing in wood yard until pulp, paper and viscose production) of the three main GHGs: CO2, CH4, and N2O.

Baseline
0.55 tCO2e/product tonne

Performance 2022

On Track

climate positive 1 — APRIL Asia

Method

To quantify the total GHG emission and removals across APRIL’s land bank from land use, APRIL follows the GHG Protocol Agricultural Guidance and IPCC Guidelines for Agricultural, Forestry, and Other Land Use. To detect the land cover change within the look-back period, i.e. 20 years APRIL utilized the remotely sensed data.

The GHG emission will be calculated as the total of carbon stock changes in woody biomass and soil organic carbon and include all major carbon fluxes such as peat decomposition, plantation growth and harvesting, and fires.

To quantify the amount of carbon unit to balance the emission, the Verified Carbon Standard (VCS), the Climate, Community and Biodiversity Standards (CCB), or other internationally accepted standard will be used.

Performance 2022

Progressing

This site is registered on wpml.org as a development site. Switch to a production site key to remove this banner.