Cari

The Zoological Society of London (ZSL) has released the results of its Sustainability Policy Transparency Toolkit, or SPOTT Assessment, that independently gauges the progress of 24 global timber, pulp and paper companies against a range of environmental, social and governance (ESG) indicators.

APRIL ranked second of 24 companies, behind Switzerland’s Interholco A.G., with a score of 67.1%, well above the average score for the sector of 37.1%. APRIL’s highest scores were for Sustainability Policy and Leadership, and Deforestation and Biodiversity. Just three of the 24 companies received a ‘Green’ rating, awarded to companies scoring above 66%.

The SPOTT assessments and the accompanying detailed company reports are designed to promote ‘transparency and accountability to drive implementation of environmental and social best practice for the sustainable production and trade of global commodities’.
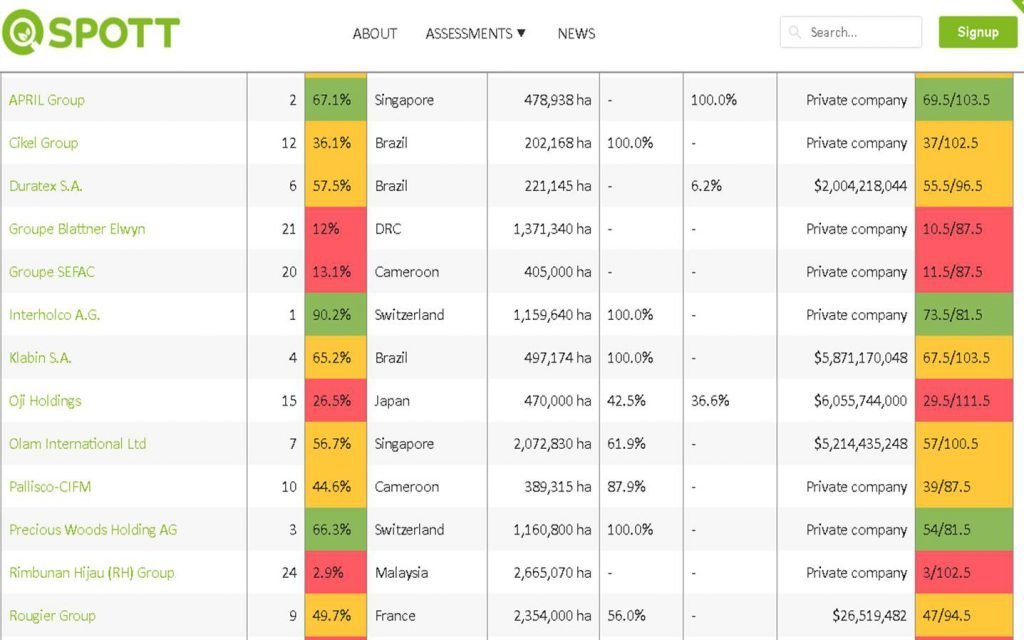
SPOTT — APRIL Asia

SPOTT scorecard

APRIL Director of Sustainability and External Affairs, Lucita Jasmin, said the assessment was important because it set an “independent baseline on which we can build further improvements in transparency and reporting. We welcome third party assessments that are based on clear framework and criteria, and where the process itself was transparent to the participants,” she added.

ZSL is an international scientific, conservation and educational charity whose mission is to promote and achieve the worldwide conservation of animals and their habitats.


Read the full announcement from SPOTT below:  

Assessing transparency in the forestry sector

Chris Eves | 09/11/2017 | London, UK

International conservation charity ZSL (Zoological Society of London) has today announced the expansion of its pioneering sustainable commodities monitoring platform, SPOTT (Sustainability Policy Transparency Toolkit), to cover the timber, pulp and paper industry, following three years of success encouraging greater transparency in the palm oil sector.

Launched in 2014 to provide investors with intelligence on whether and how key palm oil producers are setting and reporting on their environmental and social commitments, ZSL has now added timber, pulp and paper producers to the platform as part of longer-term plans to expand the range of commodities covered by SPOTT, which was recently shortlisted for a Responsible Investor award.

ZSL’s new SPOTT assessments gauge the progress of 24 timber, pulp and paper companies – all of whom have significant operations in highly-biodiverse and threatened tropical landscapes across the globe – against a range of key environmental and social sustainability indicators.

By encouraging best-practice in industries that can have significant impacts on wildlife habitats and ecosystems, as well as livelihoods, SPOTT contributes towards ZSL’s charitable mission of achieving the worldwide protection of animals and their habitats.

Mike Hoffmann, Head of ZSL’s Global Conservation Programmes, said: “We’ve already seen the impact of SPOTT in the palm oil sector, with more and more investors using the assessments to inform their due diligence and risk assessment activities and many assessed companies gradually showing an improvement in their scores over time.

“We’re now hoping to replicate this success within the timber, pulp and paper sector, where our aim is to support a greater culture of transparency, enabling investors to better gauge risk and engage productively with key players in the forest products industry.”

The expansion of the platform into timber, pulp and paper commodities marks the first in-depth evaluation of its kind in this sector, allowing investors to scrutinise how individual companies are responding to expectations and taking steps to mitigate their environmental, social and governance (ESG) risks.

ZSL’s assessments show that levels of transparency in the timber, pulp and paper sector vary greatly, with some companies scoring extremely low when assessed against SPOTT’s indicators, while others fare comparatively well. Of the companies assessed, two-thirds have a commitment to set aside areas for conservation. However, less than a third are implementing a landscape-level approach to biodiversity conservation – a crucial tool for addressing complex environmental and social challenges linked to the industry. Another such challenge is respecting the rights of indigenous communities, something that 16 of 24 companies surveyed have committed to do – although only five companies commit to fully consult with and gain the consent of these communities.

Chris Eves, ZSL’s Forestry Officer, said: “We’ve had a really encouraging response from those companies we’ve engaged during the initial round of SPOTT assessments of timber, pulp and paper producers, as the industry increasingly recognizes the advantages of increased transparency. Though many have scored lower than expected in our initial round of assessments, based on our experience in the palm oil sector we expect to see relatively rapid progress during future surveys, as companies move to implement the rigorous environmental, social, and governance-related commitments and disclosures that investors increasingly expect.

“We also found that more than half of the companies assessed are already actively working with government, NGOs or academic institutions to improve the sustainability of forest products, suggesting that the sector is taking these challenges increasingly seriously.”

svg+xml;charset=utf — APRIL Asia
sustainable growth — APRIL Asia

Method

Waste disposed is recorded through various means of measurement including estimation of weight by waste type. Particular waste types as described above are measured as a wet waste and converted to a bone dry (BD) weight. The wet waste weight is multiplied by the consistency of each waste type to determine the BD. The consistency is predetermined by the lab.

Baseline
71kg/T

Performance 2022

On Track

sustainable growth — APRIL Asia

Method

The DPTW utilisation rate and % of textile waste per tonne of product will be based on R&D lab/pilot/demo procedures.

Baseline
0%

Performance 2022

In Development

sustainable growth — APRIL Asia

Method

Water consumption per tonne of product is calculated based on water consumed in the production of saleable pulp, paper, viscose staple fiber and viscose yarn measured by flow meters, via calculation and water balances divided by the production figures for saleable pulp, paper, viscose staple fibre and viscose yarn.

Baseline
28 m3/T

Performance 2022

Not Progressing

sustainable growth — APRIL Asia

Method

Soda content within the liquor cycle and losses are determined by means of mass balance based on daily lab analysis.

Lime volume in the lime kiln and losses are determined by means of lime make-up.

The recovery rate is calculated net of the percentage of make-up amounts added. The annual figure is based on the average monthly recovery rate.

Baseline
96%

Performance 2022

Not Progressing

inclusive progress — APRIL Asia

Method

Number of Mill and Nursery contractor calculated based on Man Power data which grouped by gender level calculated as a monthly average.

Baseline
2571

inclusive progress — APRIL Asia

Method

The number of own and supply partners employees is calculated based on year-end Man Power data which is grouped by gender. The identification of leadership position refer to employees’ grade D2 or Manager level and above.

Baseline
55 women employees in leadership positions

Performance 2022

Progressing

inclusive progress — APRIL Asia

Method

Women’s effective participation is identified from the participation list for each program. Percentage of female participation is calculated by the number of women participating divided by the total participants.

Baseline
34%

Performance 2022

Progressing

inclusive progress — APRIL Asia

Method

In development

Baseline
In development

Performance 2022

Progressing

inclusive progress — APRIL Asia

Method

In development

Baseline
In development

Performance 2022

Progressing

inclusive progress — APRIL Asia

Method

In development

Baseline
In development

Performance 2022

Progressing

inclusive progress — APRIL Asia

Method

We engaged third party to conduct assessment in APRIL-supported schools using the framework that was developed by Research Triangle Institute (RTI) and USAID.

Baseline
In development

Performance 2022

Progressing

inclusive progress — APRIL Asia

Method

Poverty mapping is identified through:

  1. Desktop analysis using National Statistics, Village Potential Statistics, SMERU Poverty Map.
  2. On-the-ground verification through FGD, village transect walk, interview with community.

Baseline
3%

Performance 2022

Progressing

thriving landscapes — APRIL Asia

Method

Peer-reviewed scientific journal publication standards

Baseline
1

Performance 2022

On Track

thriving landscapes — APRIL Asia

Method

Documentation of Participation (presentation of papers or posters) in national and international dialogues, workshops and conferences

Baseline
6

Performance 2022

On Track

thriving landscapes — APRIL Asia

Method

Number of scientists from universities and research institutions that have collaborated with APRIL on peatland management during the calendar year

Baseline
9

Performance 2022

On Track

thriving landscapes — APRIL Asia

Method

Wood deliveries (excluding open market supply) to the mill are used as a basis to calculate MAI (Tonnes/ Ha/Yr). The MAI is based on the 3 year area weighted rolling average growth for all closed compartments.

Baseline
20T/ha/yr

Performance 2022

On Track

thriving landscapes — APRIL Asia

Method

Methodology to be developed specific to animal species and does not include plants. Qualifying initiatives may vary widely in nature but must have the animal protection as the primary objective.

Partnerships will be developed and documented in line with an overarching strategy prioritizing stakeholders and threats specific to the country of Indonesia assessed.

Performance 2022

Progressing

thriving landscapes — APRIL Asia

Method

May include various initiatives relating to conservation of RTE species to be defined in a priority list, initiatives may be conducted solely or in collaboration with other stakeholders.

Baseline
2

thriving landscapes — APRIL Asia

Method

Methodology to be developed to measure change in ecosystem services and values over time (carbon sequestration, water provision, resource provision including fish and honey)

Baseline
not yet developed

thriving landscapes — APRIL Asia

Method

Reports for reforestation of previously encroached and degraded area including all areas where assisted natural regeneration, planting or enrichment planting of species that improve habitat value have taken place during the year but excludes natural regeneration.

Baseline
275 ha

Performance 2022

Progressing

thriving landscapes — APRIL Asia

Method

Area within conservation is derived from land bank which is based on land cover analysis and is updated annually to capture any boundary changes, land use changes or measurement data.

Baseline
0 ha Net loss

Performance 2022

Not Progressing

thriving landscapes — APRIL Asia

Method

Landscape conservation funding includes restoration and conservation costs associated with the RER as well as the allocation of a proportion of the costs related to APRIL’s maintenance of conservation values under its production-protection model. The allocation is based on proportionate amount of each cost that is related to conservation and restoration.

The wood volume is based on wood delivered to the Mill.

Baseline
USD$0.7 per tonne of plantation fiber

Performance 2022

On Track

climate positive 1 — APRIL Asia

Method

Mill

Calculate from the records of fuel types used the amount consumed in boilers to generate power, heat and steam including energy use for mobile & including transportation. Each of the fuel types are converted to energy expressed by Giga Joule Lower Heating Value (GJ LHV) following the IPCC guidelines.

Baseline: 87%

Performance 2022

On Track

Forest Operations

Calculate from the records of fuel types the quantity consumed by major categories of forest management activities by Fiber operations.

This covers energy used for Forest operations, infrastructure including wood transport from estate to mill; When a blend of fuel types is used (such as B20) the contribution to renewable and cleaner energy targets is calculated separately for each fuel rather than considering the blend as a cleaner fuel type.

Baseline: 19%

Performance 2022

Progressing

climate positive 1 — APRIL Asia

Method

APRIL follows the international GHG protocol as developed by WRI/WBCSD to develop its emissions profile. The total emissions measured as emissions intensity is calculated based on tonnes of Scope 1 and 2 Mill Greenhouse Gas Emissions per tonne of product (paper, pulp and viscose). The emissions boundary scope covers gate-to-gate (wood processing in wood yard until pulp, paper and viscose production) of the three main GHGs: CO2, CH4, and N2O.

Baseline
0.55 tCO2e/product tonne

Performance 2022

On Track

climate positive 1 — APRIL Asia

Method

To quantify the total GHG emission and removals across APRIL’s land bank from land use, APRIL follows the GHG Protocol Agricultural Guidance and IPCC Guidelines for Agricultural, Forestry, and Other Land Use. To detect the land cover change within the look-back period, i.e. 20 years APRIL utilized the remotely sensed data.

The GHG emission will be calculated as the total of carbon stock changes in woody biomass and soil organic carbon and include all major carbon fluxes such as peat decomposition, plantation growth and harvesting, and fires.

To quantify the amount of carbon unit to balance the emission, the Verified Carbon Standard (VCS), the Climate, Community and Biodiversity Standards (CCB), or other internationally accepted standard will be used.

Performance 2022

Progressing

This site is registered on wpml.org as a development site. Switch to a production site key to remove this banner.